
Page 354 - Onboarding May 2017
P. 354
Confidential and Privileged
For The Audit and Finance Committee's Review
Work-paper #3-2:
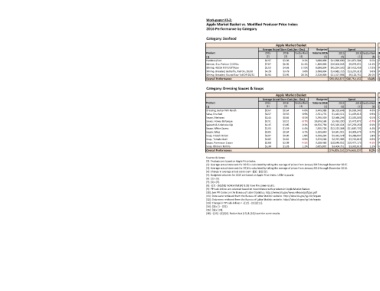
Apple Market Basket vs. Modified Producer Price Index:
2016 Performance by Category
Category: Seafood
Apple Market Basket Modified Producer Price Index (MPPI)
Average Actual Store Cost (Jan - Dec) Budgeted Spend Average PPI Sub-Indices (Jan - Dec) Indexed Cost Indexed Spend
Product 2015 2016 fav/(unfav) Volume 2016 2015 2016 fav/(unfav) Referenced PPI Sub-Indices PPI Code 2015 2016 fav/(unfav) 2016 2016 fav/(unfav)
[1] [2] [3] [4] [5] [6] [7] [8] [9] [10] [11] [12] [13] [14] [15] [16]
Haddock/Cod $3.97 $3.96 0.2% 3,000,000 $11,896,690 $11,871,584 0.2% Prepared frozen fish WPU02230602 93 95 -2.6% $4.07 $12,204,850 -2.6%
Salmon, 6 oz Portion 1/20 lbs $7.07 $6.05 14.4% 1,500,000 $10,604,043 $9,079,051 14.4% Prepared frozen fish WPU02230602 93 95 -2.6% $7.25 $10,878,720 -2.6%
Shrimp, 41/50 P/D T/Off Raw $5.63 $4.68 17.0% 8,000,004 $45,054,520 $37,413,456 17.0% Prepared frozen shellfish WPU02230603 104 105 -1.2% $5.70 $45,611,911 -1.2%
Shrimp, Breaded, Butterfly, Tail On, 26/30 $4.20 $3.79 9.6% 3,500,004 $14,682,725 $13,267,319 9.6% Prepared frozen shellfish WPU02230603 104 105 -1.2% $4.25 $14,864,372 -1.2%
Shrimp, Breaded, Round Raw Tail Off 26/31 $4.94 $3.95 20.1% 2,310,000 $11,417,898 $9,122,751 20.1% Prepared frozen shellfish WPU02230603 104 105 -1.2% $5.00 $11,559,154 -1.2%
Overall Performance $93,655,877 $80,754,162 13.8% Overall Performance $95,119,007 -1.6%
Category: Dressing Sauces & Soups
Apple Market Basket Modified Producer Price Index (MPPI)
Average Actual Store Cost (Jan - Dec) Budgeted Spend Average PPI Sub-Indices (Jan - Dec) Indexed Cost Indexed Spend
Product 2015 2016 fav/(unfav) Volume 2016 2015 2016 fav/(unfav) Referenced PPI Sub-Indices PPI Code 2015 2016 fav/(unfav) 2016 2016 fav/(unfav)
[1] [2] [3] [4] [5] [6] [7] [8] [9] [10] [11] [12] [13] [14] [15] [16]
Dressing, Buttermilk Ranch $0.67 $0.64 4.0% 9,449,088 $6,318,648 $6,063,343 4.0% Mayonnaise, salad dressings, and sandwich spreads WPU02890102 222 219 1.2% $0.66 $6,243,816 1.2%
Salsa, Crushed $0.57 $0.56 0.9% 2,551,776 $1,442,551 $1,429,615 0.9% Canned catsup and other tomato based sauces WPU02440127 156 151 3.6% $0.54 $1,390,138 3.6%
Sauce, Marinara $0.44 $0.44 0.5% 5,596,320 $2,466,236 $2,455,083 0.5% Canned catsup and other tomato based sauces WPU02440127 156 151 3.6% $0.42 $2,376,629 3.6%
Sauce, Honey Barbeque $0.51 $0.51 -0.7% 10,676,568 $5,432,200 $5,472,872 -0.7% Prepared sauces, except tomato WPU02860103 158 158 -0.1% $0.51 $5,435,345 -0.1%
Spinach & Artichoke Dip $1.45 $1.45 0.3% 10,556,730 $15,320,024 $15,270,250 0.3% Prepared sauces, except tomato WPU02860103 158 158 -0.1% $1.45 $15,328,895 -0.1%
Sauce, White Queso $1.66 $1.59 4.4% 7,366,728 $12,222,388 $11,687,722 4.4% Prepared sauces, except tomato WPU02860103 158 158 -0.1% $1.66 $12,229,465 -0.1%
Sauce, Wing $0.85 $0.84 0.7% 5,109,840 $4,341,921 $4,309,673 0.7% Prepared sauces, except tomato WPU02860103 158 158 -0.1% $0.85 $4,344,435 -0.1%
Soup, French Onion $0.97 $0.96 1.8% 4,558,284 $4,442,578 $4,360,847 1.8% Frozen dinners and nationality foods WPU02850111 166 160 3.0% $0.94 $4,307,263 3.0%
Soup, Tomato Basil $0.82 $0.81 0.9% 3,379,068 $2,767,983 $2,743,810 0.9% Frozen dinners and nationality foods WPU02850111 166 160 3.0% $0.79 $2,683,674 3.0%
Sauce, Parmesan Cream $2.00 $2.09 -4.5% 9,328,481 $18,646,851 $19,477,173 -4.5% Prepared sauces, except tomato WPU02860103 158 158 -0.1% $2.00 $18,657,648 -0.1%
Soup, Chicken Tortilla $1.30 $1.28 1.2% 2,625,892 $3,404,751 $3,362,819 1.2% Frozen dinners and nationality foods WPU02850111 166 160 3.0% $1.26 $3,301,047 3.0%
Overall Performance $76,806,131 $76,633,207 0.2% Overall Performance $76,298,356 0.7%
Sources & Notes:
[1]: Products are based on Apple Price Index.
[2]: Average actual store cost for 2015 is calculated by taking the average of prices from January 2015 through December 2015.
[3]: Average actual store cost for 2016 is calculated by taking the average of prices from January 2016 through December 2016.
[4]: Change in average actual store cost= -{[3] - [2]}/[2].
[5]: Budgeted volumes for 2016 are based on Apple Price Index. UOM is pound.
[6]: [2] x [5].
[7]: [3] x [5].
[8]: -{[7] - [6]}/[6]. Notice that [4] & [8] have the same results.
[9]: PPI sub-indices are selected based on resemblance with products in Apple Market Basket.
[10]: See PPI Codes on the Bureau of Labor Statistics: http://www.bls.gov/news.release/pdf/ppi.pdf
[11]: Data were retrieved from the Bureau of Labor Statistic website: http://data.bls.gov/cgi-bin/srgate
[12]: Data were retrieved from the Bureau of Labor Statistic website: http://data.bls.gov/cgi-bin/srgate
[13]: Change in PPI sub-indices = -{[12] - [11]}/[11].
[14]: [2] x {1 - [13]}.
[15]: [5] x [14].
[16]: -{[15] - [6]}/[6]. Notice that [13] & [16] have the same results.