
Page 356 - Onboarding May 2017
P. 356
Confidential and Privileged
For The Audit and Finance Committee's Review
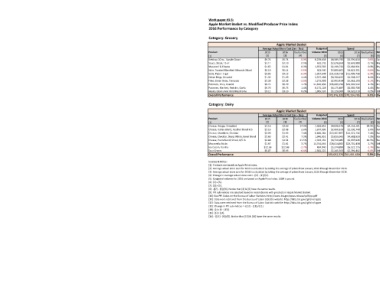
Work-paper #3-3:
Apple Market Basket vs. Modified Producer Price Index:
2016 Performance by Category
Category: Grocery
Apple Market Basket Modified Producer Price Index (MPPI)
Average Actual Store Cost (Jan - Dec) Budgeted Spend Average PPI Sub-Indices (Jan - Dec) Indexed Cost Indexed Spend
Product 2015 2016 fav/(unfav) Volume 2016 2015 2016 fav/(unfav) Referenced PPI Sub-Indices PPI Code 2015 2016 fav/(unfav) 2016 2016 fav/(unfav)
[1] [2] [3] [4] [5] [6] [7] [8] [9] [10] [11] [12] [13] [14] [15] [16]
Ketchup 20 oz., Upside Down $0.74 $0.74 0.0% 6,239,638 $4,589,790 $4,591,830 0.0% Canned catsup and other tomato based sauces WPU02440127 156 151 3.6% $0.71 $4,423,026 3.6%
Sauce, Steak, 15 oz $4.11 $4.10 0.1% 652,242 $2,678,654 $2,676,989 0.1% Prepared sauces, except tomato WPU02860103 158 158 -0.1% $4.11 $2,680,205 -0.1%
Macaroni & Cheese $1.62 $1.61 0.3% 1,353,505 $2,190,722 $2,184,931 0.3% Dry macaroni, spaghetti, and egg noodle products WPU0214020303 120 115 4.1% $1.55 $2,100,431 4.1%
Nuts, Toasted Blanched Almonds Sliced $6.10 $6.14 -0.6% 623,040 $3,800,661 $3,825,301 -0.6% Nuts (salted, roasted, cooked, or blanched) WPU025503041 188 160 14.9% $5.19 $3,234,377 14.9%
Soda, Pepsi - 5 gal $3.85 $4.12 -6.9% 2,937,648 $11,318,718 $12,099,756 -6.9% Liquid beverage bases, excluding use by soft drink WPU02640109 181 181 0.1% $3.85 $11,303,645 0.1%
Onion Rings, Breaded $1.35 $1.29 4.4% 3,537,468 $4,780,492 $4,568,257 4.4% Frozen vegetables, other than potato products WPU02450509 136 136 -0.4% $1.36 $4,800,727 -0.4%
Fries, Green Bean, Tempura $2.28 $2.33 -2.1% 1,273,008 $2,903,424 $2,963,193 -2.1% Frozen vegetables, other than potato products WPU02450509 136 136 -0.4% $2.29 $2,915,714 -0.4%
Potatoes, Fries, Coated $0.71 $0.70 1.7% 51,610,836 $36,609,790 $35,994,522 1.7% Frozen potato products (French-fried, patties, puff) WPU02450202 239 241 -0.9% $0.72 $36,936,288 -0.9%
Potatoes, Mashed, Redskin, Garlic $0.76 $0.75 1.4% 8,173,128 $6,175,887 $6,089,706 1.4% Round red potatoes WPU01130604 151 171 -13.8% $0.86 $7,030,752 -13.8%
Hearty Grains And Wild Mushroms $3.11 $3.10 0.2% 1,005,535 $3,128,000 $3,120,310 0.2% Other Frozen Specialties, Excluding Seafood WPU02850113 184 185 -0.6% $3.13 $3,148,094 -0.6%
Overall Performance $78,176,138 $78,114,795 0.1% Overall Performance $78,573,258 -0.5%
Category: Dairy
Apple Market Basket Modified Producer Price Index (MPPI)
Average Actual Store Cost (Jan - Dec) Budgeted Spend Average PPI Sub-Indices (Jan - Dec) Indexed Cost Indexed Spend
Product 2015 2016 fav/(unfav) Volume 2016 2015 2016 fav/(unfav) Referenced PPI Sub-Indices PPI Code 2015 2016 fav/(unfav) 2016 2016 fav/(unfav)
[1] [2] [3] [4] [5] [6] [7] [8] [9] [10] [11] [12] [13] [14] [15] [16]
Cheese, Asiago, Shredded $3.16 $2.69 14.9% 1,583,616 $4,998,578 $4,253,281 14.9% Natural cheese, except lowfat, shipped in packages WPU023302122 86 83 3.5% $3.04 $4,822,026 3.5%
Cheese, Italian Blend, Feather Shred 4/5 $2.13 $2.08 2.6% 1,247,995 $2,660,618 $2,592,748 2.6% Natural cheese, except lowfat, shipped in packages WPU023302122 86 83 3.5% $2.06 $2,566,644 3.5%
Cheese, Shredded, Cheddar $2.09 $1.93 7.4% 6,400,284 $13,367,897 $12,372,756 7.4% Natural cheese, except lowfat, shipped in packages WPU023302122 86 83 3.5% $2.01 $12,895,738 3.5%
Cheese, Cheddar, Sharp White, Bevel Shred $2.60 $2.41 7.3% 1,946,952 $5,059,042 $4,688,923 7.3% Natural cheese, except lowfat, shipped in packages WPU023302122 86 83 3.5% $2.51 $4,880,355 3.5%
Cheese, Parm Blend, Shred, 6/5 lb $2.88 $2.54 11.5% 2,334,132 $6,710,985 $5,937,826 11.5% Natural cheese, except lowfat, shipped in packages WPU023302122 86 83 3.5% $2.77 $6,473,951 3.5%
Mozzarella Sticks $1.67 $1.61 3.7% 14,744,664 $24,614,865 $23,701,438 3.7% Other frozen specialties, excluding seafood WPU02850113 184 185 -0.6% $1.68 $24,772,989 -0.6%
Ice Cream, Vanilla $12.36 $12.69 -2.7% 434,940 $5,374,889 $5,521,175 -2.7% Ice cream, excl. lowfat and nonfat (incl. custards) WPU023402012 106 106 0.0% $12.36 $5,374,465 0.0%
Sour Cream $0.87 $0.93 -6.6% 2,583,222 $2,245,503 $2,393,482 -6.6% Other fluid milk related products, packaged WPU02310304 222 236 -6.5% $0.93 $2,390,938 -6.5%
Overall Performance $65,032,376 $61,461,630 5.5% Overall Performance $64,177,106 1.3%
Sources & Notes:
[1]: Products are based on Apple Price Index.
[2]: Average actual store cost for 2015 is calculated by taking the average of prices from January 2015 through December 2015.
[3]: Average actual store cost for 2016 is calculated by taking the average of prices from January 2016 through December 2016.
[4]: Change in average actual store cost= -{[3] - [2]}/[2].
[5]: Budgeted volumes for 2016 are based on Apple Price Index. UOM is pound.
[6]: [2] x [5].
[7]: [3] x [5].
[8]: -{[7] - [6]}/[6]. Notice that [4] & [8] have the same results.
[9]: PPI sub-indices are selected based on resemblance with products in Apple Market Basket.
[10]: See PPI Codes on the Bureau of Labor Statistics: http://www.bls.gov/news.release/pdf/ppi.pdf
[11]: Data were retrieved from the Bureau of Labor Statistic website: http://data.bls.gov/cgi-bin/srgate
[12]: Data were retrieved from the Bureau of Labor Statistic website: http://data.bls.gov/cgi-bin/srgate
[13]: Change in PPI sub-indices = -{[12] - [11]}/[11].
[14]: [2] x {1 - [13]}.
[15]: [5] x [14].
[16]: -{[15] - [6]}/[6]. Notice that [13] & [16] have the same results.