
Page 353 - Onboarding May 2017
P. 353
Confidential and Privileged
For The Audit and Finance Committee's Review
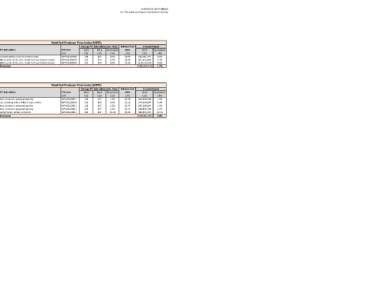
Work-paper #3-1:
Apple Market Basket vs. Modified Producer Price Index:
2016 Performance by Category
Category: Beef
Apple Market Basket Modified Producer Price Index (MPPI)
Average Actual Store Cost (Jan - Dec) Budgeted Spend Average PPI Sub-Indices (Jan - Dec) Indexed Cost Indexed Spend
Product 2015 2016 fav/(unfav) Volume 2016 2015 2016 fav/(unfav) Referenced PPI Sub-Indices PPI Code 2015 2016 fav/(unfav) 2016 2016 fav/(unfav)
[1] [2] [3] [4] [5] [6] [7] [8] [9] [10] [11] [12] [13] [14] [15] [16]
Beef, Brisket, Fully Cooked Shredded 15% $6.69 $5.77 13.7% 2,000,000 $13,371,100 $11,543,119 13.7% Frozen ground meat patties, portion control meats WPU02210586 138 125 9.6% $6.04 $12,081,747 9.6%
Beef, Fresh Ground Chuck Bulk, 6 lb, 75/25 $2.96 $2.38 19.4% 18,042,240 $53,342,443 $43,017,696 19.4% Boxed meat (beef, pork, lamb, etc.), made from purchased carcass WPU02210504 119 114 3.7% $2.85 $51,352,668 3.7%
Beef, Top Butt Sirloin Ɨ $5.36 $5.36 0.0% 23,323,260 $124,910,999 $124,910,999 0.0% Boxed meat (beef, pork, lamb, etc.), made from purchased carcass WPU02210504 114 114 0.0% $5.36 $124,910,999 0.0%
Overall Performance $191,624,542 $179,471,814 6.3% Overall Performance $188,345,413 1.7%
Ɨ This item was approved by the Board to have unchanged costs due to the change in specification from tri-tip to top butt sirloin.
Category: Poultry
Apple Market Basket Modified Producer Price Index (MPPI)
Average Actual Store Cost (Jan - Dec) Budgeted Spend Average PPI Sub-Indices (Jan - Dec) Indexed Cost Indexed Spend
Product 2015 2016 fav/(unfav) Volume 2016 2015 2016 fav/(unfav) Referenced PPI Sub-Indices PPI Code 2015 2016 fav/(unfav) 2016 2016 fav/(unfav)
[1] [2] [3] [4] [5] [6] [7] [8] [9] [10] [11] [12] [13] [14] [15] [16]
Chicken Tenders, Breaded, Homestyle $2.33 $2.25 3.4% 14,499,996 $33,744,466 $32,597,589 3.4% Canned, cooked, smoked or prepared poultry WPU02220811 128 127 1.0% $2.30 $33,409,538 1.0%
Chicken, Breast, 7 oz Plain $2.36 $2.24 5.1% 33,000,000 $77,904,301 $73,898,112 5.1% Young chickens, including bulk, chilled, frozen, whole WPU02220333 172 164 4.3% $2.26 $74,534,894 4.3%
Chicken, Chunks, Boneless, Breaded $1.99 $1.92 3.9% 30,000,000 $59,802,164 $57,452,469 3.9% Canned, cooked, smoked or prepared poultry WPU02220811 128 127 1.0% $1.97 $59,208,604 1.0%
Chicken, Wings, IF Mrn Crispy $2.16 $2.14 1.2% 8,799,996 $19,042,200 $18,820,950 1.2% Canned, cooked, smoked or prepared poultry WPU02220811 128 127 1.0% $2.14 $18,853,198 1.0%
Turkey, Breast, Roasted, Sliced $5.22 $6.03 -15.5% 2,312,472 $12,079,518 $13,947,530 -15.5% Turkeys, including frozen, whole, and parts WPU02220611 163 147 10.1% $4.69 $10,855,455 10.1%
Overall Performance $202,572,649 $196,716,649 2.9% Overall Performance $196,861,691 2.8%
Sources & Notes:
[1]: Products are based on Apple Price Index.
[2]: Average actual store cost for 2015 is calculated by taking the average of prices from January 2015 through December 2015.
[3]: Average actual store cost for 2016 is calculated by taking the average of prices from January 2016 through December 2016.
[4]: Change in average actual store cost= -{[3] - [2]}/[2].
[5]: Budgeted volumes for 2016 are based on Apple Price Index. UOM is pound.
[6]: [2] x [5].
[7]: [3] x [5].
[8]: -{[7] - [6]}/[6]. Notice that [4] & [8] have the same results.
[9]: PPI sub-indices are selected based on resemblance with products in Apple Market Basket.
[10]: See PPI Codes on the Bureau of Labor Statistics: http://www.bls.gov/news.release/pdf/ppi.pdf
[11]: Data were retrieved from the Bureau of Labor Statistic website: http://data.bls.gov/cgi-bin/srgate
[12]: Data were retrieved from the Bureau of Labor Statistic website: http://data.bls.gov/cgi-bin/srgate
[13]: Change in PPI sub-indices = -{[12] - [11]}/[11].
[14]: [2] x {1 - [13]}.
[15]: [5] x [14].
[16]: -{[15] - [6]}/[6]. Notice that [13] & [16] have the same results.