Page 348 - Onboarding May 2017
P. 348

Confidential and Privileged
                                                                                                                                           For the Audit and Finance Committee's Review
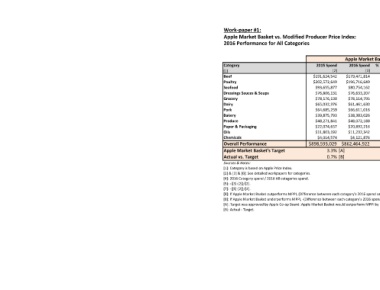
                                                                   Work-paper #1:
                                                                   Apple Market Basket vs. Modified Producer Price Index:
                                                                   2016 Performance for All Categories
                                                                                                       Apple Market Basket              MPPI         Advantage Driver
                                                                   Category                   2015 Spend  2016 Spend  % Spend 2016  fav/(unfav)  2016 Indexed Spend  fav/(unfav)  fav/(unfav)
                                                                   [1]                             [2]      [3]      [4]     [5]         [6]       [7]         [8]
                                                                   Beef                      $191,624,542  $179,471,814  20.8%  6.3%  $188,345,413  1.7%     39.2%
                                                                   Poultry                   $202,572,649  $196,716,649  22.8%  2.9%  $196,861,691  2.8%     0.6%
                                                                   Seafood                    $93,655,877  $80,754,162  9.4%  13.8%  $95,119,007  -1.6%      63.5%
                                                                   Dressings Sauces & Soups   $76,806,131  $76,633,207  8.9%  0.2%  $76,298,356   0.7%       -1.5%
                                                                   Grocery                    $78,176,138  $78,114,795  9.1%  0.1%  $78,573,258  -0.5%       2.0%
                                                                   Dairy                      $65,032,376  $61,461,630  7.1%  5.5%  $64,177,106   1.3%       12.0%
                                                                   Pork                       $64,685,259  $66,611,016  7.7%  -3.0%  $64,402,672  0.4%       -9.8%
                                                                   Bakery                     $39,875,793  $38,383,026  4.5%  3.7%  $39,808,905   0.2%       6.3%
                                                                   Produce                    $48,271,841  $48,072,188  5.6%  0.4%  $43,831,349   9.2%      -18.8%
                                                                   Paper & Packaging          $22,074,657  $20,892,216  2.4%  5.4%  $21,812,337   1.2%       4.1%
                                                                   Oils                       $11,803,192  $11,232,342  1.3%  4.8%  $11,759,479   0.4%       2.3%
                                                                   Chemicals                  $4,014,574  $4,121,876  0.5%  -2.7%    $4,085,981  -1.8%       -0.2%
                                                                   Overall Performance      $898,593,029 $862,464,922  100%  4.0%  $885,075,554  1.5%        100%
                                                                   Apple Market Basket's Target  3.3% [A]
                                                                   Actual vs. Target             0.7% [B]
                                                                   Sources & Notes:
                                                                   [1]: Category is based on Apple Price Index.
                                                                   [2] & [3] & [6]: See detailed workpapers for categories.
                                                                   [4]: 2016 Category spend / 2016 All categories spend.
                                                                   [5]: -{[3]-[2]}/[2].
                                                                   [7]: -{[5]-[2]}/[2].
                                                                   [8]: If Apple Market Basket outperforms MPPI, (Difference between each category's 2016 spend and 2016 index spend/Difference between all categories' 2016 spend and 2016 index spend).
                                                                   [8]: If Apple Market Basket underperforms MPPI, -(Difference between each category's 2016 spend and 2016 index spend/Difference between all categories' 2016 spend and 2016 index spend).
                                                                   [A]: Target was approved by Apple Co-op Board: Apple Market Basket would outperform MPPI by 1.82%.
                                                                   [B]: Actual - Target.
   343   344   345   346   347   348   349   350   351   352   353