
Page 48 - PM#102_all
P. 48
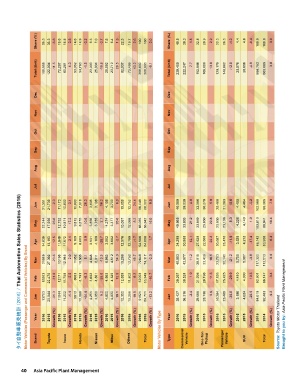
Share (%)  29.5  33.3  -3.8  19.6  18.8  0.8  14.6  14.9  -0.2  6.3  7.0  -0.7  7.8  6.4  1.3  22.3  19.7  2.6  100  100  0.0  Share (%)  40.8  39.3  1.5  32.8  29.9  2.9  22.0  26.0  -4.0  4.4  4.8  -0.4  100.0  100.0  0.0


                Total (Unit)   108,669  122,804  -11.5  72,287  69,281  4.3  53,952  54,793  -1.5  23,093  25,834  -10.6  28,592  23,719  20.5  82,037  72,499  13.2  368,630  368,930  -0.1  Total (Unit)   239,460  222,247  7.7  192,546  169,080  13.9  129,170  146,862  -12.0  25,576  26,896  -4.9  586,752  565,085  3.8


                Dec                                                   Dec


                Nov                                                   Nov


                Oct                                                   Oct


                Sep                                                   Sep


                Aug                                                   Aug


                Jul                                                   Jul

         タイ自動車販売統計 (2016) / Thai Automotive Sales Statistics (2016)
                Jun  21,301  21,739  -2.0  11,173  10,833  3.1  10,003  7,918  26.3  3,605  3,108  16.0  4,108  3,793  8.3  15,859  12,752  24.4  66,049  60,322  9.5  Jun  40,589  39,039  4.0  32,056  30,279  5.9  25,460  21,283  19.6  4,455  4,464  -0.2  102,560  95,065  7.9


                May  22,244  17,966  23.8  12,752  10,871  17.3  9,812  8,875  10.6  3,856  3,755  2.7  4,274  3,377  26.6  13,097  12,098  8.3  66,035  56,942  16.0  May  40,985  33,803  21.2  33,549  25,850  29.8  25,050  23,139  8.3  4,226  4,149  1.9  103,810  86,941  19.4


                Apr  14,839  13,193  12.5  11,949  11,672  2.4  9,109  8,603  5.9  2,931  4,109  -28.7  3,582  3,682  -2.7  12,576  12,799  -1.7  54,986  54,058  1.7  Apr  34,299  30,588  12.1  27,628  22,606  22.2  20,687  23,470  -11.9  3,528  4,272  -17.4  86,142  80,936  6.4
            Motor Vehicles (Passenger and Commercial Vehicles) By Brand
                Mar   21019  27,392  -23.3  13198  12,945  2.0  11352  10,505  8.1  4,848  6,011  -19.3  6,963  4,512  54.3  15,266  12,752  19.7  72646  74,117  -2.0  Mar   48,883  43,977  11.2  38,915  33,409  16.5  23,763  30,140  -21.2  5,759  5,987  -3.8  117,320  113,513  3.4


                Feb  15503  22,470  -31.0  12171  11,758  3.5  8063  8,793  -8.3  3,602  4,801  -25.0  4,865  4,325  12.5  12,889  11,802  9.2  57093  63,949  -10.7  Feb  39,267  38,524  1.9  31,398  28,198  11.3  17,826  25,425  -29.9  4,410  4,000  10.3  92,901  96,147  -3.4


                Jan  13763  20,044  -31.3  11044  11,202  -1.4  5613  10,099  -44.4  4,251  4,050  5.0  4,800  4,030  19.1  12,350  10,296  19.9  51821  59,721  -13.2  Jan  35,437  36,316  -2.4  29,000  28,738  0.9  16,384  23,405  -30.0  3,198  4,024  -20.5  84,019  92,483  -9.2 Brought to you by: Asia Pacific Plant Management


                Year  2016  2015  Growth (%)  2016  2015  Growth (%)  2016  2015  Growth (%)  2016  2015  Growth (%)  2016  2015  Growth (%)  2016  2015  Growth (%)  2016  2015  Growth (%)  Year  2016  2015  Growth (%)  2016  2015  Growth (%)  2016  2015  Growth (%)  2016  2015  Growth (%)  2015  2014  Growth (%)  Source: Toyota Motor Thailand


                Brand  Toyota  Isuzu  Honda  Nissan  Mitsu  Others  Total  Motor Vehicles By Type   Type  Commercial  Vehicle  One-Ton   Pickup  Passenger   Vehicle  SUV  Total


          40       Asia Pacific Plant Management