
Page 3 - Module 14 Pattern Formations
P. 3
Module 14 – Pattern Formations
1. introduction
In this section, we’ll discuss a bit more how to use chart patterns to your advantage. It’s not enough
to just know how the tools work, you’ve got to learn how to use them. Chart patterns are categorized
according to the signals they give.
2. reversal chart patterns
Reversal patterns are those chart formations that signal that the ongoing trend is about to change
course. If reversals chart pattern forms during an uptrend, it hints that the trend will reverse and
that the price will head down soon. Conversely, if a reversal chart pattern is seen during a downtrend,
it suggests that the price will move up later.
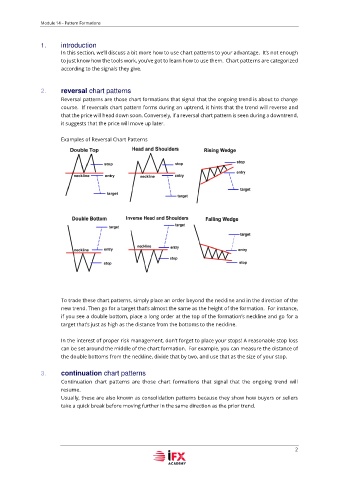
Examples of Reversal Chart Patterns
To trade these chart patterns, simply place an order beyond the neckline and in the direction of the
new trend. Then go for a target that’s almost the same as the height of the formation. For instance,
if you see a double bottom, place a long order at the top of the formation’s neckline and go for a
target that’s just as high as the distance from the bottoms to the neckline.
In the interest of proper risk management, don’t forget to place your stops! A reasonable stop loss
can be set around the middle of the chart formation. For example, you can measure the distance of
the double bottoms from the neckline, divide that by two, and use that as the size of your stop.
3. continuation chart patterns
Continuation chart patterns are those chart formations that signal that the ongoing trend will
resume.
Usually, these are also known as consolidation patterns because they show how buyers or sellers
take a quick break before moving further in the same direction as the prior trend.
2