
Page 6 - Module 14 Pattern Formations
P. 6
Module 14 – Pattern Formations
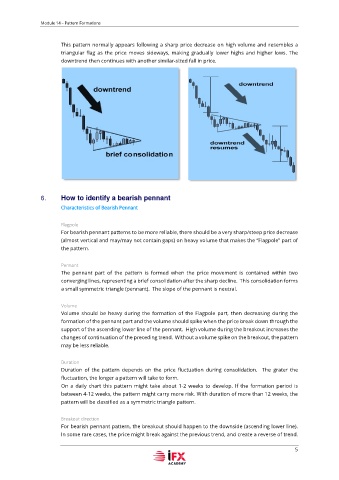
This pattern normally appears following a sharp price decrease on high volume and resembles a
triangular flag as the price moves sideways, making gradually lower highs and higher lows. The
downtrend then continues with another similar-sized fall in price.
6. How to identify a bearish pennant
Characteristics of Bearish Pennant
Flagpole
For bearish pennant patterns to be more reliable, there should be a very sharp/steep price decrease
(almost vertical and may/may not contain gaps) on heavy volume that makes the “Flagpole” part of
the pattern.
Pennant
The pennant part of the pattern is formed when the price movement is contained within two
converging lines, representing a brief consolidation after the sharp decline. This consolidation forms
a small symmetric triangle (pennant). The slope of the pennant is neutral.
Volume
Volume should be heavy during the formation of the Flagpole part, then decreasing during the
formation of the pennant part and the volume should spike when the price break down through the
support of the ascending lower line of the pennant. High volume during the breakout increases the
changes of continuation of the preceding trend. Without a volume spike on the breakout, the pattern
may be less reliable.
Duration
Duration of the pattern depends on the price fluctuation during consolidation. The grater the
fluctuation, the longer a pattern will take to form.
On a daily chart this pattern might take about 1-2 weeks to develop. If the formation period is
between 4-12 weeks, the pattern might carry more risk. With duration of more than 12 weeks, the
pattern will be classified as a symmetric triangle pattern.
Breakout direction
For bearish pennant pattern, the breakout should happen to the downside (ascending lower line).
In some rare cases, the price might break against the previous trend, and create a reverse of trend.
5