Page 11 - Module 14 Pattern Formations
P. 11

Module 14 – Pattern Formations


                      Place your profit target
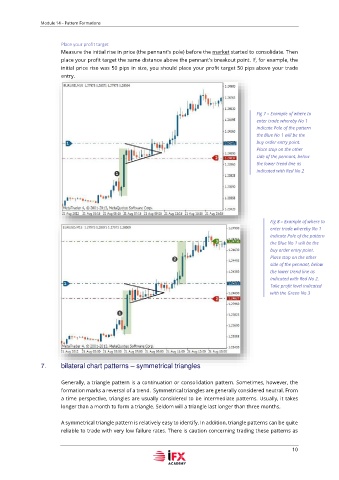
                      Measure the initial rise in price (the pennant's pole) before the market started to consolidate. Then
                      place your profit target the same distance above the pennant's breakout point. If, for example, the
                      initial price rise was 50 pips in size, you should place your profit target 50 pips above your trade
                      entry.


                                                                                           Fig 7 – Example of where to
                                                                                           enter trade whereby No 1
                                                                                           indicate Pole of the pattern
                                                                                           the Blue No 1 will be the
                                                                                           buy order entry point.
                                                                                           Place stop on the other
                                                                                           side of the pennant, below
                                                                                           the lower trend line as
                                                                                           indicated with Red No 2


                                                                                                Fig 8 – Example of where to
                                                                                                enter trade whereby No 1
                                                                                                indicate Pole of the pattern
                                                                                                the Blue No 1 will be the
                                                                                                buy order entry point.
                                                                                                Place stop on the other
                                                                                                side of the pennant, below
                                                                                                the lower trend line as
                                                                                                indicated with Red No 2.
                                                                                                Take profit level indicated
                                                                                                with the Green No 3


               7.     bilateral chart patterns – symmetrical triangles

                      Generally, a triangle pattern is a continuation or consolidation pattern. Sometimes, however, the
                      formation marks a reversal of a trend.  Symmetrical triangles are generally considered neutral. From
                      a time perspective, triangles are usually considered to be intermediate patterns. Usually, it takes
                      longer than a month to form a triangle. Seldom will a triangle last longer than three months.

                      A symmetrical triangle pattern is relatively easy to identify. In addition, triangle patterns can be quite
                      reliable to trade with very low failure rates. There is caution concerning trading these patterns as

                                                                                                        10
   6   7   8   9   10   11   12   13   14   15   16