
Page 16 - Module 14 Pattern Formations
P. 16
Module 14 – Pattern Formations
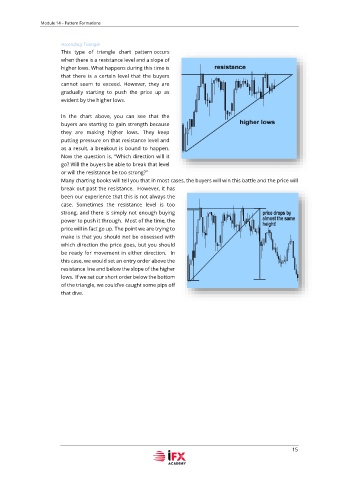
Ascending Triangle
This type of triangle chart pattern occurs
when there is a resistance level and a slope of
higher lows. What happens during this time is
that there is a certain level that the buyers
cannot seem to exceed. However, they are
gradually starting to push the price up as
evident by the higher lows.
In the chart above, you can see that the
buyers are starting to gain strength because
they are making higher lows. They keep
putting pressure on that resistance level and
as a result, a breakout is bound to happen.
Now the question is, “Which direction will it
go? Will the buyers be able to break that level
or will the resistance be too strong?”
Many charting books will tell you that in most cases, the buyers will win this battle and the price will
break out past the resistance. However, it has
been our experience that this is not always the
case. Sometimes the resistance level is too
strong, and there is simply not enough buying
power to push it through. Most of the time, the
price will in fact go up. The point we are trying to
make is that you should not be obsessed with
which direction the price goes, but you should
be ready for movement in either direction. In
this case, we would set an entry order above the
resistance line and below the slope of the higher
lows. If we set our short order below the bottom
of the triangle, we could’ve caught some pips off
that dive.
15