
Page 17 - Module 14 Pattern Formations
P. 17
Module 14 – Pattern Formations
Descending Triangle
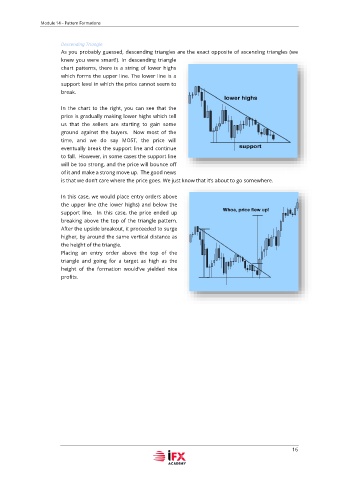
As you probably guessed, descending triangles are the exact opposite of ascending triangles (we
knew you were smart!). In descending triangle
chart patterns, there is a string of lower highs
which forms the upper line. The lower line is a
support level in which the price cannot seem to
break.
In the chart to the right, you can see that the
price is gradually making lower highs which tell
us that the sellers are starting to gain some
ground against the buyers. Now most of the
time, and we do say MOST, the price will
eventually break the support line and continue
to fall. However, in some cases the support line
will be too strong, and the price will bounce off
of it and make a strong move up. The good news
is that we don’t care where the price goes. We just know that it’s about to go somewhere.
In this case, we would place entry orders above
the upper line (the lower highs) and below the
support line. In this case, the price ended up
breaking above the top of the triangle pattern.
After the upside breakout, it proceeded to surge
higher, by around the same vertical distance as
the height of the triangle.
Placing an entry order above the top of the
triangle and going for a target as high as the
height of the formation would’ve yielded nice
profits.
16