
Page 12 - Module 14 Pattern Formations
P. 12
Module 14 – Pattern Formations
triangle pattern can be either continuation or reversal patterns. Typically, they are continuation
patterns. To achieve the reliability for which the triangle is well known, technical analysts advise
waiting for a clear breakout of one of the Trendlines defining the triangle.
Triangle patterns are usually susceptible to definite and dependable analysis, with the proviso that
the investor must wait for a reliable, as opposed to a premature, breakout.
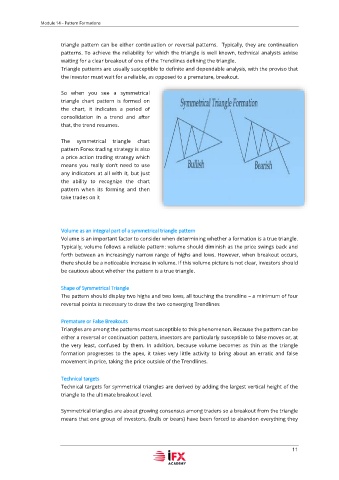
So when you see a symmetrical
triangle chart pattern is formed on
the chart, it indicates a period of
consolidation in a trend and after
that, the trend resumes.
The symmetrical triangle chart
pattern Forex trading strategy is also
a price action trading strategy which
means you really don’t need to use
any indicators at all with it, but just
the ability to recognize the chart
pattern when its forming and then
take trades on it
Volume as an integral part of a symmetrical triangle pattern
Volume is an important factor to consider when determining whether a formation is a true triangle.
Typically, volume follows a reliable pattern: volume should diminish as the price swings back and
forth between an increasingly narrow range of highs and lows. However, when breakout occurs,
there should be a noticeable increase in volume. If this volume picture is not clear, investors should
be cautious about whether the pattern is a true triangle.
Shape of Symmetrical Triangle
The pattern should display two highs and two lows, all touching the trendline – a minimum of four
reversal points is necessary to draw the two converging Trendlines
Premature or False Breakouts
Triangles are among the patterns most susceptible to this phenomenon. Because the pattern can be
either a reversal or continuation pattern, investors are particularly susceptible to false moves or, at
the very least, confused by them. In addition, because volume becomes as thin as the triangle
formation progresses to the apex, it takes very little activity to bring about an erratic and false
movement in price, taking the price outside of the Trendlines.
Technical targets
Technical targets for symmetrical triangles are derived by adding the largest vertical height of the
triangle to the ultimate breakout level.
Symmetrical triangles are about growing consensus among traders so a breakout from the triangle
means that one group of investors, (bulls or bears) have been forced to abandon everything they
11