
Page 14 - Module 14 Pattern Formations
P. 14
Module 14 – Pattern Formations
How to Trade Symmetrical Triangle Chart Patterns
A symmetrical triangle is a chart formation where the
slope of the price’s highs and the slope of the price’s
lows converge together to a point where it looks like
a triangle. What’s happening during this formation is
that the market is making lower highs and higher
lows. This means that neither the buyers nor the
sellers are pushing the price far enough to make a
clear trend. If this were a battle between the buyers
and sellers, then this would be a draw. This is also a
type of consolidation.
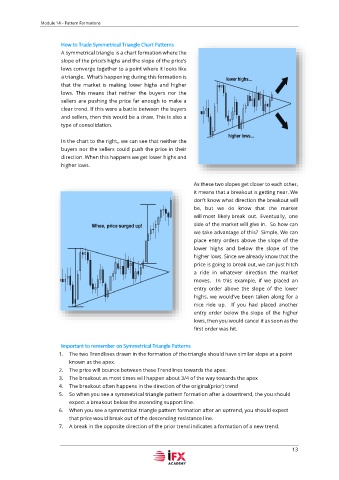
In the chart to the right,, we can see that neither the
buyers nor the sellers could push the price in their
direction. When this happens we get lower highs and
higher lows.
As these two slopes get closer to each other,
it means that a breakout is getting near. We
don’t know what direction the breakout will
be, but we do know that the market
will most likely break out. Eventually, one
side of the market will give in. So how can
we take advantage of this? Simple. We can
place entry orders above the slope of the
lower highs and below the slope of the
higher lows. Since we already know that the
price is going to break out, we can just hitch
a ride in whatever direction the market
moves. In this example, if we placed an
entry order above the slope of the lower
highs, we would’ve been taken along for a
nice ride up. If you had placed another
entry order below the slope of the higher
lows, then you would cancel it as soon as the
first order was hit.
Important to remember on Symmetrical Triangle Patterns
1. The two Trendlines drawn in the formation of the triangle should have similar slope at a point
known as the apex.
2. The price will bounce between these Trendlines towards the apex.
3. The breakout as most times will happen about 3/4 of the way towards the apex
4. The breakout often happens in the direction of the original(prior) trend
5. So when you see a symmetrical triangle pattern formation after a downtrend, the you should
expect a breakout below the ascending support line.
6. When you see a symmetrical triangle pattern formation after an uptrend, you should expect
that price would break out of the descending resistance line.
7. A break in the opposite direction of the prior trend indicates a formation of a new trend.
13