Page 9 - Module 14 Pattern Formations
P. 9

Module 14 – Pattern Formations


                      Place your profit target
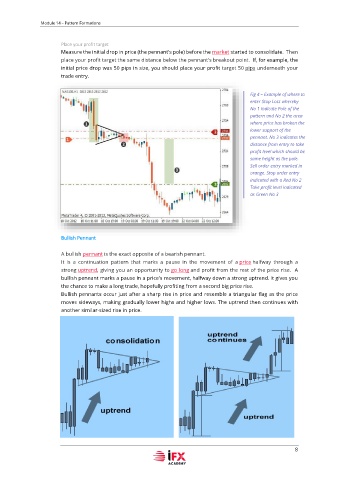
                      Measure the initial drop in price (the pennant's pole) before the market started to consolidate.  Then
                      place your profit target the same distance below the pennant's breakout point.  If, for example, the
                      initial price drop was 50 pips in size, you should place your profit target 50 pips underneath your
                      trade entry.

                                                                                         Fig 4 – Example of where to
                                                                                         enter Stop Loss whereby
                                                                                         No 1 indicate Pole of the
                                                                                         pattern and No 2 the area
                                                                                         where price has broken the
                                                                                         lower support of the
                                                                                         pennant. No 3 indicates the
                                                                                         distance from entry to take
                                                                                         profit level which should be
                                                                                         same height as the pole.
                                                                                         Sell order entry marked in
                                                                                         orange. Stop order entry
                                                                                         indicated with a Red No 2
                                                                                         Take profit level indicated
                                                                                         as Green No 3


                      Bullish Pennant

                      A bullish pennant is the exact opposite of a bearish pennant.
                      It  is  a  continuation  pattern  that  marks  a  pause  in  the  movement  of  a price halfway  through  a
                      strong uptrend, giving you an opportunity to go long and profit from the rest of the price rise.  A
                      bullish pennant marks a pause in a price's movement, halfway down a strong uptrend. It gives you
                      the chance to make a long trade, hopefully profiting from a second big price rise.
                      Bullish pennants occur just after a sharp rise in price and resemble a triangular flag as the price
                      moves sideways, making gradually lower highs and higher lows. The uptrend then continues with
                      another similar-sized rise in price.


                      How to identify a bullish pennant


                                                                                                         8
   4   5   6   7   8   9   10   11   12   13   14