
Page 7 - Module 14 Pattern Formations
P. 7
Module 14 – Pattern Formations
This reversal pattern may be signaled during the pennant formation by a significant increase in
volume instead of decreasing.
Potential Price Target
Compute the height of the flagpole
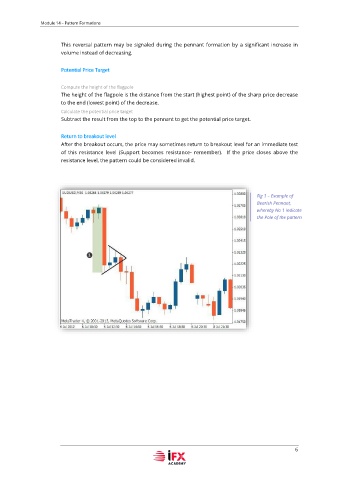
The height of the flagpole is the distance from the start (highest point) of the sharp price decrease
to the end (lowest point) of the decrease.
Calculate the potential price target
Subtract the result from the top to the pennant to get the potential price target.
Return to breakout level
After the breakout occurs, the price may sometimes return to breakout level for an immediate test
of this resistance level (Support becomes resistance- remember). If the price closes above the
resistance level, the pattern could be considered invalid.
Fig 1 – Example of
Bearish Pennant,
whereby No 1 indicate
the Pole of the pattern
6