Page 2 - Neighborhood-Report_Austin-TX-78705_2017-04-20-20-44-14_Neat
P. 2

Austin, TX78705

Neighborhood: Housing Stats and Charts

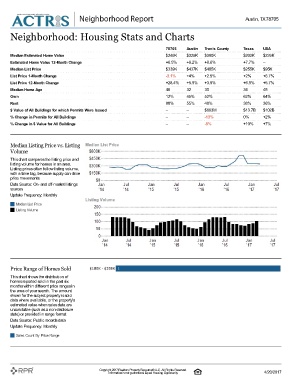
Median Estimated Home Value                             78705   Austin                                                                          Travis County  Texas   USA
Estimated Home Value 12-Month Change                    $249K   $325K                                                                           $300K          $202K   $226K
Median List Price                                       +6.5%   +9.2%                                                                           +9.6%          +7.7%   –
List Price 1-Month Change                               $339K   $437K                                                                           $405K          $255K   $95K
List Price 12-Month Change                              -3.1%   +4%                                                                             +2.5%          +2%     +6.7%
Median Home Age                                         +28.4%  +5.9%                                                                           +3.9%          +6.9%   +5.7%
Own                                                     48      32                                                                              30             34      45
Rent                                                    12%     45%                                                                             52%            62%     64%
$ Value of All Buildings for which Permits Were Issued  88%     55%                                                                             48%            38%     36%
% Change in Permits for All Buildings                   –       –                                                                               $663M          $13.7B  $102B
% Change in $ Value for All Buildings                   –       –                                                                               -13%           0%      +2%
                                                        –       –                                                                               -8%            +10%    +7%

Median Listing Price vs. Listing
Volume

Thischart comparesthe listing price and
listing volume for homesin an area.
Listing pricesoften follow listing volume,
with a time lag, because supply can drive
price movements.

Data Source: On- and off-market listings
sources

Update Frequency: Monthly

    Median List Price
    Listing Volume

Price Range of Homes Sold                                                                                                                                              4/20/2017

Thischart showsthe distribution of
homesreported sold in the past six
monthswithin different price rangesin
the area of your search. The amount
shown for the subject property issold
data where available, or the property's
estimated value when salesdata are
unavailable (such asa non-disclosure
state) or provided in range format.
Data Source: Public recordsdata
Update Frequency: Monthly

    Sales Count By Price Range

                                                                           Copyright 2017 Realtors PropertyResource® LLC. All Rights Reserved.
                                                                                  Information is not guaranteed. Equal Housing Opportunity.
   1   2   3   4   5   6   7