
Page 7 - Neighborhood-Report_Austin-TX-78705_2017-04-20-20-44-14_Neat
P. 7
Austin, TX78705
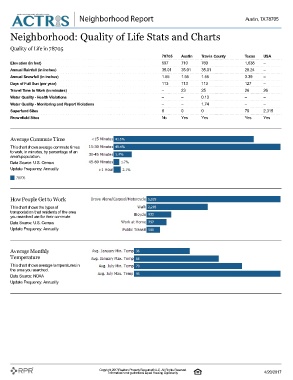
Neighborhood: Quality of Life Stats and Charts
Quality of Life in 78705 78705 Austin Travis County Texas USA
597 710 760 1,638 –
Elevation (in feet) 35.01 35.01 35.01 28.24 –
Annual Rainfall (in inches) 1.55 1.55 1.55 3.39 –
Annual Snowfall (in inches) 113 113 113 127 –
Days of Full Sun (per year) – 23 25 26 26
Travel Time to Work (in minutes) – – 0.13 – –
Water Quality - Health Violations – – 1.74 – –
Water Quality - Monitoring and Report Violations 0 0 0 70 2,315
Superfund Sites No Yes Yes Yes Yes
Brownfield Sites
Average Commute Time
Thischart showsaverage commute times
to work, in minutes, by percentage of an
area's population.
Data Source: U.S. Census
Update Frequency: Annually
78705
How People Get to Work
Thischart showsthe typesof
transportation that residentsof the area
you searched use for their commute.
Data Source: U.S. Census
Update Frequency: Annually
Average Monthly
Temperature
Thischart showsaverage temperaturesin
the area you searched.
Data Source: NOAA
Update Frequency: Annually
Copyright 2017 Realtors PropertyResource® LLC. All Rights Reserved. 4/20/2017
Information is not guaranteed. Equal Housing Opportunity.