
Page 50 - ASBIRES-2017_Preceedings
P. 50
AN IDENTIFICATION OF KEY PERFORMANCE INDICATORS FOR MEASURING ORGANIZATIONAL
PERFORMANCE IN TEAM LEADER BASED ORGANIZATION CULTURAL CONTEXT: A CASE STUDY
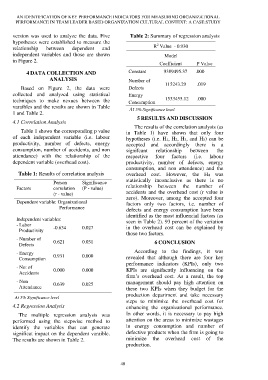
version was used to analyze the data. Five Table 2: Summary of regression analysis
hypotheses were established to measure the 2
relationship between dependent and R Value - 0.930
independent variables and those are shown Model
in Figure 2.
Coefficient P Value
4 DATA COLLECTION AND Constant 9389495.37 .000
ANALYSIS Number of
Based on Figure 2, the data were Defects 115243.29 .019
collected and analyzed using statistical Energy
techniques to make nexues between the Consumption 1533455.12 .000
varaibles and the results are shown in Table At 5% Significance level
1 and Table 2.
5 RESULTS AND DISCUSSION
4.1 Correlation Analysis
The results of the correlation analysis (as
Table 1 shows the corresponding p value in Table 1) have shown that only four
of each independent variable (i.e. labour hypotheses (i.e. H1, H2, H3, and H5) can be
productivity, number of defects, energy accepted and accordingly there is a
consumption, number of accidents, and non signifcant relationship between the
attendance) with the relationship of the respective four factors (i.e. labour
dependent variable (overhead cost). productivity, number of defects, energy
consumption, and non attendence) and the
Table 1: Results of correlation analysis overhead cost. However, the H4 was
statistically inconclusive as there is no
Person Significance
Factors correlation (P - value) relationship between the number of
(r - value) accidents and the overhead cost (r value is
zero). Moreover, among the accepted four
Dependent variable: Organizational factors only two factors, i.e. number of
Performance defects and energy consumption have been
identified as the most influencial factors (as
Independent variables: seen in Table 2). 93 percent of the variation
- Labor
Productivity -0.634 0.027 in the overhead cost can be explained by
those two factors.
- Number of 0.621 0.031
Defects 6 CONCLUSION
- Energy 0.931 0.000 According to the findings, it was
Consumption revealed that although there are four key
performance indicators (KPIs), only two
- No: of
Accidents 0.000 0.000 KPIs are signifacntly influencing on the
firm’s overhead cost. As a result, the top
- Non management should pay high attention on
Attendance 0.639 0.025 these two KPIs when they budget for the
production department and take necessary
At 5% Significance level
steps to minimize the overhead cost for
4.2 Regression Analysis enhancing the organizational performance.
The multiple regression analysis was In other words, it is necessary to pay high
performed using the stepwise method to attention on the areas to minimize wastages
identify the variables that can generate in energy consumption and number of
significat impact on the dependent varaible. defective products when the firm is going to
The results are shown in Table 2. minimize the overhead cost of the
production.
40