Page 45 - ASBIRES-2017_Preceedings
P. 45

Kaushalya & Francisco


                     H :series is stationary                               The Phillips-Perron Test was performed
                       1
                         Augmented Dickey-Fuller Test                  to identify the stationarity of the difference
                                                                       series.
                         data:  Dengue_Kurunegala_No.of. cases         Phillips-Perron Unit Root Test
                         Dickey-Fuller = -2.0651, Lag order = 4,
                         p-value = 0.5491                              data:  non_seasonal_difference
                         alternative hypothesis: stationary            Dickey-Fuller Z(alpha) = -56.34, Truncation
                                                                       lag parameter = 3, p-value = 0.01
                        Since p value (0.5491) was greater than
                     the  5%  significance  level.  The  result        alternative hypothesis: stationary
                     indicated, the series is not stationary at 5%     Warning message:
                     significance      level.      Non-seasonal
                     differencing was done for the original data.      Inpp.test(non_seasonal_difference):  p-value
                                                                       smaller than printed p-value


                        Figure 2: Autocorrelation function of
                                    original data


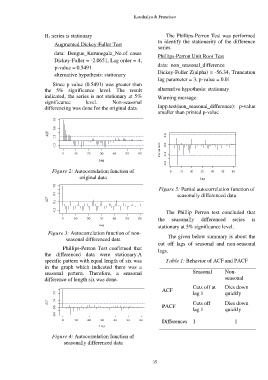
                                                                        Figure 5: Partial autocorrelation function of
                                                                                seasonally differenced data


                                                                           The  Phillip  Perron  test  concluded  that
                                                                       the   seasonally   differenced   series   is
                                                                       stationary at 5% significance level.
                       Figure 3: Autocorrelation function of non-           The given below summary is about the
                              seasonal differenced data
                                                                       cut  off  lags  of  seasonal  and  non-seasonal
                             Phillips-Perron  Test  confirmed  that    lags.
                     the  differenced  data  were  stationary.A
                     specific pattern with equal length of six was         Table 1: Behavior of ACF and PACF
                     in  the  graph  which  indicated  there  was  a
                     seasonal  pattern.  Therefore,  a  seasonal                       Seasonal      Non-
                     difference of length six was done.                                              seasonal

                                                                         ACF           Cuts off at   Dies down
                                                                                       lag 1         quickly
                                                                                       Cuts off      Dies down
                                                                         PACF
                                                                                       lag 1         quickly

                                                                         Differences  1                  1


                        Figure 4: Autocorrelation function of
                             seasonally differenced data


                                                                     35
   40   41   42   43   44   45   46   47   48   49   50