
Page 40 - ASBIRES-2017_Preceedings
P. 40
A STUDY ON ORGANIZATIONAL COMMITMENT OF NON-MANAGERIAL EMPLOYEES AND
WASTAGE AT THE CEYLON ELECTRICITY BOARD
corresponding Ljung-Box Chi-square shown in Table 8.The predictive
statistics are shown in Table 5. performance was measured and MAPE for
Model 1 was 2.35%. That is the accuracy of
Table 5: Modified Box-Pierce (Ljung-Box) forecast from Model 1 was 97.65%. This
Chi-square statistic indicates that predictive performance is
significantly high in Model 1.
Chi- p-
Model
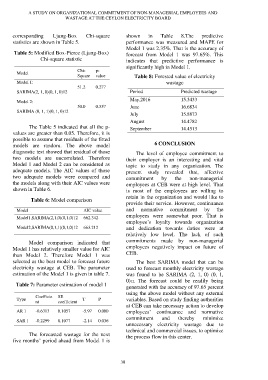
Square value Table 8: Forested value of electricity
Model 1: wastage
51.2 0.277
SARIMA(2, 1, 0)(0, 1, 0)12 Period Predicted wastage
Model 2: May,2016 15.3433
50.0 0.357 June 16.6834
SARIMA (0, 1, 1)(0, 1, 0)12
July 15.8873
August 14.4782
The Table 5 indicated that all the p- September 14.4513
values are greater than 0.05. Therefore, it is
possible to assume that residuals of the fitted
models are random. The above model 6 CONCLUSION
diagnostic test showed that residual of those The level of employee commitment to
two models are uncorrelated. Therefore their employer is an interesting and vital
Model 1 and Model 2 can be considered as topic to study in any organization. The
adequate models. The AIC values of those present study revealed that, affective
two adequate models were compared and commitment by the non-managerial
the models along with their AIC values were employees at CEB were at high level. That
shown in Table 6. is most of the employees are willing to
retain in the organization and would like to
Table 6: Model comparison
provide their service. However, continuance
Model AIC value and normative commitment by the
Model1,SARIMA(2,1,0)(0,1,0)12 662.342 employees were somewhat poor. That is
employee’s loyalty towards organization
Model2,SARIMA(0,1,1)(0,1,0)12 663.212 and dedication towards duties were at
relatively low level. The lack of such
Model comparison indicated that commitments made by non-managerial
Model 1 has relatively smaller value for AIC employees negatively impact on future of
than Model 2. Therefore Model 1 was CEB.
selected as the best model to forecast future The best SARIMA model that can be
electricity wastage at CEB. The parameter used to forecast monthly electricity wastage
estimation of the Model 1 is given in table 7. was found to be SARIMA (2, 1, 0) (0, 1,
0)12. The forecast could be readily being
Table 7: Parameter estimation of model 1 generated with the accuracy of 97.65 percent
using the above model without any external
Coefficie SE
Type T P variables. Based on study finding authorities
nt coefficient
at CEB can take necessary action to develop
AR 1 -0.6313 0.1057 -5.97 0.000 employees’ continuance and normative
commitment and thereby minimize
SAR 1 -0.2299 0.1077 -2.14 0.036
unnecessary electricity wastage due to
technical and commercial issues, to optimize
The forecasted wastage for the next the process flow in this center.
five months’ period ahead from Model 1 is
30