
Page 38 - ASBIRES-2017_Preceedings
P. 38
A STUDY ON ORGANIZATIONAL COMMITMENT OF NON-MANAGERIAL EMPLOYEES AND
WASTAGE AT THE CEYLON ELECTRICITY BOARD
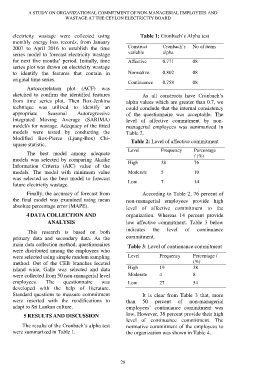
electricity wastage were collected using Table 1: Cronbach’s Alpha test
monthly energy loss records, from January
2007 to April 2016 to establish the time Construct Cronbach’s No of items
series model to forecast electricity wastage variable alpha
for next five months’ period. Initially, time Affective 0.771 08
series plot was drawn on electricity wastage
to identify the features that contain in Normative 0.802 08
original time series.
Continuance 0.758 08
Autocorrelation plot (ACF) was
sketched to confirm the identified features As all constructs have Cronbach’s
from time series plot. Then Box-Jenkins alpha values which are greater than 0.7, we
technique was utilized to identify an could conclude that the internal consistency
appropriate Seasonal Autoregressive of the questionnaire was acceptable. The
Integrated Moving Average (SARIMA) level of affective commitment by non-
model/s for wastage. Adequacy of the fitted managerial employees was summarized in
models were tested by conducting the Table 2.
Modified Box-Pierce (Ljung-Box) Chi- Table 2: Level of affective commitment
square statistic.
Level Frequency Percentage
The best model among adequate / (%)
models was selected by comparing Akaike High 38 76
Information Criteria (AIC) value of the
models. The model with minimum value Moderate 5 10
was selected as the best model to forecast Low 7 14
future electricity wastage.
Finally, the accuracy of forecast from According to Table 2, 76 percent of
the final model was examined using mean non-managerial employees provide high
absolute percentage error (MAPE). level of affective commitment to the
4 DATA COLLECTION AND organization. Whereas 14 percent provide
ANALYSIS low affective commitment. Table 3 below
indicates the level of continuance
This research is based on both
primary data and secondary data. As the commitment.
main data collection method, questionnaires Table 3: Level of continuance commitment
were distributed among the employees who
were selected using simple random sampling Level Frequency Percentage /
method. Out of the CEB branches located (%)
island wide, Galle was selected and data High 19 38
were collected from 50 non-managerial level Moderate 4 8
employees. The questionnaire was Low 27 54
developed with the help of literature.
Standard questions to measure commitment It is clear from Table 3 that, more
were inserted with the modifications to than 50 percent of non-managerial
adapt to Sri Lankan culture. employees’ continuance commitment was
5 RESULTS AND DISCUSSION low. However, 38 percent provide their high
level of continuance commitment. The
The results of the Cronbach’s alpha test normative commitment of the employees to
were summarized in Table 1. the organization was shown in Table 4.
28