
Page 44 - ASBIRES-2017_Preceedings
P. 44
A TIME SERIES MODEL TO FORECAST DENGUE FEVER INCIDENCES IN KURUNEGALA DISTRICT
(∇ x )=x -x (7) The Akaike information criterion (AIC)
t
L t
t-L
is a measure of the goodness of fit of
where L is the seasonal length. statistical models for a given set of data.
3.7 Seasonal Integrated Auto Regressive AIC=2k- 2ln(L) (9)
Moving Average (SARIMA) Models where, L be the maximum value of the
Seasonal Integrated AutoRegressive likelihood function for the model and k be
Moving Average model is used when there the number of estimated parameters in the
is seasonal difference and non-seasonal model.
difference done for the data. The general When there are several models, the
notation of this model is model with the lowest AIC value is accepted
SARIMA(p, d, q)(P, D, Q) where as the best fitting model.
s
p = cutoff non-seasonal lag of Partial 3.9 Mean Squared Percentage Error(MAPE)
Autocorrelation function(PACF)
q = cutoff non-seasonal lag of ∑ |actual value-forecasted value|
Autocorrelation function(ACF) MAPE= actual value (10)
number of forecasts used
d = no of non-seasonal differences done If there is a less mean squared
to make the original time series stationary. percentage error in a model, then it is said to
P = cutoff seasonal lag of Partial be a good model to fit data.
Autocorrelation function(PACF) 3.10 Bayesian Information Criterion (BIC)
Q = cutoff seasonal lag of The model with the lowest BIC is
Autocorrelation function(ACF) considered as the best model. The BIC is
D = no of seasonal differences done to defined as
̂
make the original time series stationary. BIC=-2 ln L+k ln(n) (11)
̂
s = seasonal length L= the maximized value of the likelihood
3.8 Modified Box-Pierce (Ljung-Box) Chi- function of the model
square Test n= the number of data points in observed
data
The Modified Box-Pierce (Ljung-Box)
Chi-square statistic is used to check the k=the number of parameters to be estimated
significance of the magnitudes of the
residual autocorrelations. 4 RESULTS AND DISCUSSION
H :ρ =ρ =…=ρ
0
1
k
2
H :ρ ≠ρ ≠…≠ρ
1
k
2
1
The test statistic defined is
2
γ
*
i
Q =n(n+2) ∑ k i=1 n-k (8)
Test statistic of Modified Box Pierce
Chi Square statistic. Where,
2
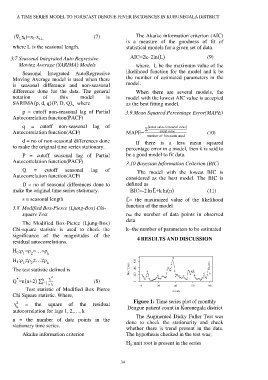
γ = the square of the residual Figure 1: Time series plot of monthly
k
autocorrelation for lags 1, 2,…, k Dengue patient count in Kurunegala district
The Augmented Dicky Fuller Test was
n = the number of data points in the done to check the stationarity and check
stationary time series.
whether there is trend present in the data.
Akaike information criterion The hypothesis checked in the test was;
H :unit root is present in the series
0
34