
Page 23 - 6_Spread
P. 23
9102 – يوُيو5 تزوة كوية اهطياحة واهفِادق – عدد
according to (A.OAC, 2005).
Hypotheses of the study
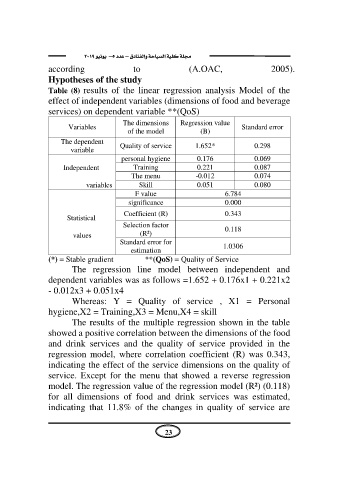
Table (8) results of the linear regression analysis Model of the
effect of independent variables (dimensions of food and beverage
services) on dependent variable **(QoS)
Variables The dimensions Regression value Standard error
The dependent of the model (B)
variable Quality of service 1.652* 0.298
Independent personal hygiene 0.176 0.069
Training 0.221 0.087
variables The menu -0.012 0.074
Skill 0.051 0.080
F value
6.784
significance 0.000
Statistical Coefficient (R) 0.343
values 0.118
Selection factor 1.0306
(R²)
Standard error for
estimation
(*) = Stable gradient **(QoS) = Quality of Service
The regression line model between independent and
dependent variables was as follows =1.652 + 0.176x1 + 0.221x2
- 0.012x3 + 0.051x4
Whereas: Y = Quality of service , X1 = Personal
hygiene,X2 = Training,X3 = Menu,X4 = skill
The results of the multiple regression shown in the table
showed a positive correlation between the dimensions of the food
and drink services and the quality of service provided in the
regression model, where correlation coefficient (R) was 0.343,
indicating the effect of the service dimensions on the quality of
service. Except for the menu that showed a reverse regression
model. The regression value of the regression model (R²) (0.118)
for all dimensions of food and drink services was estimated,
indicating that 11.8% of the changes in quality of service are
23