
Page 140 - ansys
P. 140
The basic steps for generating a mesh or outline plot are as follows:
1. Choose the surfaces for which you want to display the mesh or outline in the Surfaces list. If you
want to select several surfaces of the same type, you can select that type in the Surface Types list
instead. All of the surfaces of that type will be selected automatically in the Surfaces list (or
deselected, if they are all selected already).
2. Depending on what you want to draw, do one or more of the following:
w To draw an outline of the selected surfaces, select Edges under Options and Outline under Edge
Type. If you need more detail in the outline display of a complex geometry, see the description of
the Feature option, below.
w To draw the mesh edges, select Edges under Options and All under Edge Type.
w To generate a filled-mesh display, select Faces under Options.
w To draw the nodes on the selected surfaces, select Nodes under Options.
3. Set any of the mesh and outline display options described below.
4. Click the Display button to draw the specified mesh or outline in the active graphics window.
If you choose to display filled meshes, and you want a smoothly shaded display, you should turn on
lighting and select a lighting interpolation method other than Flat in the Display Options dialog
box or the Lights dialog box.
If you display nodes, and you want to change the symbol representing the nodes, you can change the
Point Symbol in the Display Options dialog box. See Section 29.2.7: Modifying the Rendering Options
for details.
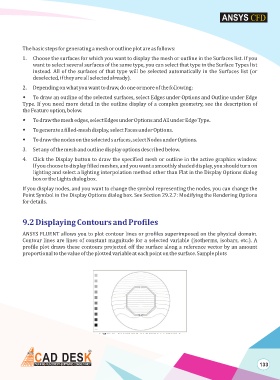
9.2 Displaying Contours and Profiles
ANSYS FLUENT allows you to plot contour lines or profiles superimposed on the physical domain.
Contour lines are lines of constant magnitude for a selected variable (isotherms, isobars, etc.). A
profile plot draws these contours projected off the surface along a reference vector by an amount
proportional to the value of the plotted variable at each point on the surface. Sample plots
Figure: Contours of Static Pressure
133