
Page 142 - ansys
P. 142
The basic steps for generating a contour or profile plot are as follows:
1. Select the variable or function to be contoured or profiled in the Contours of drop-down list. First
select the desired category in the upper list; you may then select a related quantity in the lower list.
2. Choose the surface or surfaces on which to draw the contours or profiles in the Surfaces list. For
2D cases, if no surface is selected, contouring or profiling is done on the entire domain. For 3D cases,
you must always select at least one surface
3. Specify the number of contours or profiles in the Levels field. The maximum number of levels
allowed is 100.
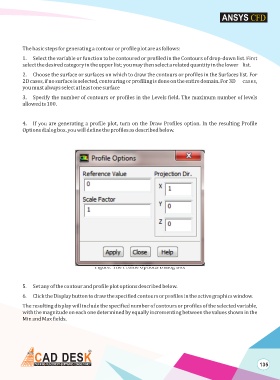
4. If you are generating a profile plot, turn on the Draw Profiles option. In the resulting Profile
Options dialog box. you will define the profiles as described below.
Figure: The Profile Options Dialog Box
5. Set any of the contour and profile plot options described below.
6. Click the Display button to draw the specified contours or profiles in the active graphics window.
The resulting display will include the specified number of contours or profiles of the selected variable,
with the magnitude on each one determined by equally incrementing between the values shown in the
Min and Max fields.
135