
Page 138 - ansys
P. 138
CHAPTER
9 Fluent Graphics
9.1 Introduction
Graphics tools available in ANSYS FLUENT allow you to process the information contained in your CFD
solution and easily view the results. The following sections explain how to use these tools to examine
your solution.
(a) Basic Graphics Generation
In ANSYS FLUENT you can generate graphics displays showing meshes, contours, profiles, vectors,
and path lines. Some graphics are generated using variables that are plotted directly from the ANSYS
FLUENT data file once the file has been read. The variables listed in the data file depend on the models
active at the time the file is written. Variables that are required by the solver, based on the current
model settings, but are missing from the data file are set to their default values. For those missing
variables, one iteration should be performed in order to obtain the required values for generating the
plot.
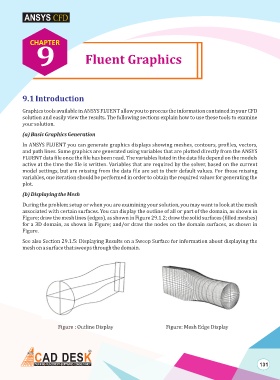
(b) Displaying the Mesh
During the problem setup or when you are examining your solution, you may want to look at the mesh
associated with certain surfaces. You can display the outline of all or part of the domain, as shown in
Figure; draw the mesh lines (edges), as shown in Figure 29.1.2; draw the solid surfaces (filled meshes)
for a 3D domain, as shown in Figure; and/or draw the nodes on the domain surfaces, as shown in
Figure.
See also Section 29.1.5: Displaying Results on a Sweep Surface for information about displaying the
mesh on a surface that sweeps through the domain.
Figure : Outline Display Figure: Mesh Edge Display
131