
Page 214 - The Power of Light, Colour and Sound for Health and Wellness draft
P. 214
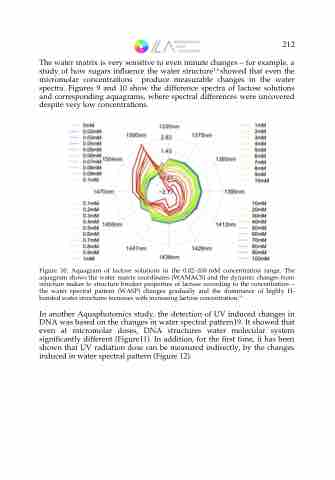
 The water matrix is very sensitive to even minute changes – for example, a study of how sugars infuence the water structure1 6 showed that even the micromolar concentrations produce measurable changes in the water spectra. Figures 9 and 10 show the difference spectra of lactose solutions and corresponding aquagrams, where spectral differences were uncovered despite very low concentrations.
Figure 10. Aquagram of lactose solutions in the 0.02–100 mM concentration range. The aquagram shows the water matrix coordinates (WAMACS) and the dynamic changes from structure maker to structure breaker properties of lactose according to the concentration – the water spectral pattern (WASP) changes gradually and the dominance of highly H- bonded water structures increases with increasing lactose concentration.16
In another Aquaphotomics study, the detection of UV induced changes in DNA was based on the changes in water spectral pattern19. It showed that even at micromolar doses, DNA structures water molecular system signifcantly different (Figure11). In addition, for the frst time, it has been shown that UV radiation dose can be measured indirectly, by the changes induced in water spectral pattern (Figure 12).
212
