
Page 216 - The Power of Light, Colour and Sound for Health and Wellness draft
P. 216
214
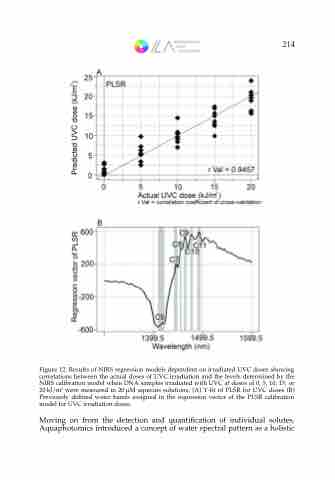
Figure 12. Results of NIRS regression models dependent on irradiated UVC doses showing correlations between the actual doses of UVC irradiation and the levels determined by the NIRS calibration model when DNA samples irradiated with UVC at doses of 0, 5, 10, 15, or 20 kJ/m2 were measured in 20 μM aqueous solutions. (A) Y-ft of PLSR for UVC doses (B) Previously defned water bands assigned in the regression vector of the PLSR calibration model for UVC irradiation doses.
Moving on from the detection and quantifcation of individual solutes, Aquaphotomics introduced a concept of water spectral pattern as a holistic
