
Page 215 - The Power of Light, Colour and Sound for Health and Wellness draft
P. 215
213
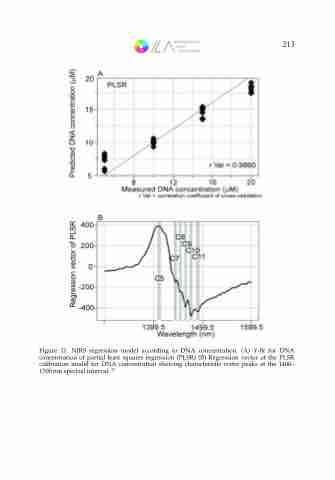
Figure 11. NIRS regression model according to DNA concentration. (A) Y-ft for DNA concentration of partial least squares regression (PLSR) (B) Regression vector of the PLSR calibration model for DNA concentration showing characteristic water peaks at the 1400– 1500 nm spectral interval. 19
