
Page 15 - ROPD 2018 Annual Report
P. 15
Section 2 patrol division Analysis
Patrol Division analysis
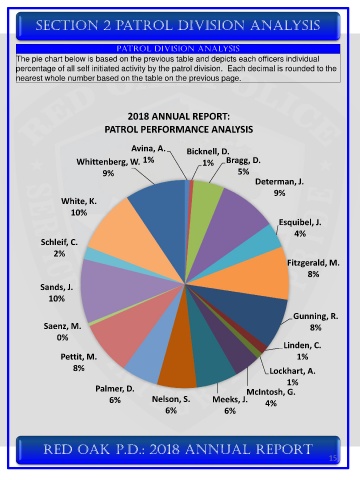
The pie chart below is based on the previous table and depicts each officers individual
percentage of all self initiated activity by the patrol division. Each decimal is rounded to the
nearest whole number based on the table on the previous page.
2018 ANNUAL REPORT:
PATROL PERFORMANCE ANALYSIS
Avina, A. Bicknell, D.
Whittenberg, W. 1% 1% Bragg, D.
9% 5%
Determan, J.
9%
White, K.
10%
Esquibel, J.
4%
Schleif, C.
2%
Fitzgerald, M.
8%
Sands, J.
10%
Gunning, R.
Saenz, M. 8%
0%
Linden, C.
Pettit, M. 1%
8% Lockhart, A.
1%
Palmer, D. McIntosh, G.
6% Nelson, S. Meeks, J. 4%
6% 6%
Red Oak P.D.: 2018 ANNUAL REPORT
15