
Page 19 - ROPD 2018 Annual Report
P. 19
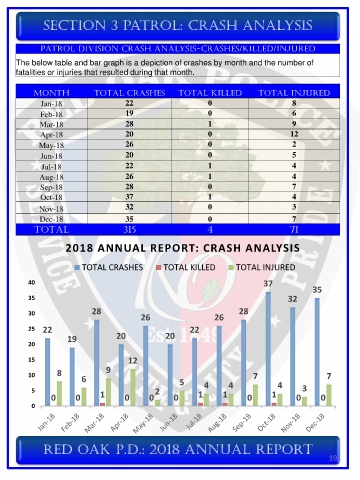
Section 3 patrol: crash analysis


             Patrol Division Crash Analysis-Crashes/Killed/Injured

      The below table and bar graph is a depiction of crashes by month and the number of
      fatalities or injuries that resulted during that month.


           MONTH             TOTAL CRASHES            TOTAL KILLED             TOTAL INJURED
             Jan-18                    22                      0                         8
             Feb-18                    19                      0                         6
             Mar-18                    28                      1                         9
             Apr-18                    20                      0                        12
             May-18                    26                      0                         2
             Jun-18                    20                      0                         5
             Jul-18                    22                      1                         4
             Aug-18                    26                      1                         4
             Sep-18                    28                      0                         7
             Oct-18                    37                      1                         4
             Nov-18                    32                      0                         3
             Dec-18                    35                      0                         7
           TOTAL                      315                      4                        71


                     2018 ANNUAL REPORT: CRASH ANALYSIS

                          TOTAL CRASHES           TOTAL KILLED          TOTAL INJURED

          40                                                                    37
                                                                                               35
          35                                                                           32

          30                 28                                          28
                                           26                    26
          25  22                                          22
                     19             20             20
          20

          15                           12

          10      8              9                                           7                     7
                         6                             5
           5                                    2             4       4             4       3
                0       0      1      0       0      0      1       1      0       1      0      0
           0


              Red Oak P.D.: 2018 ANNUAL REPORT
                                                                                                    19