
Page 18 - ROPD 2018 Annual Report
P. 18
Section 2 patrol division Analysis
Patrol Division analysis
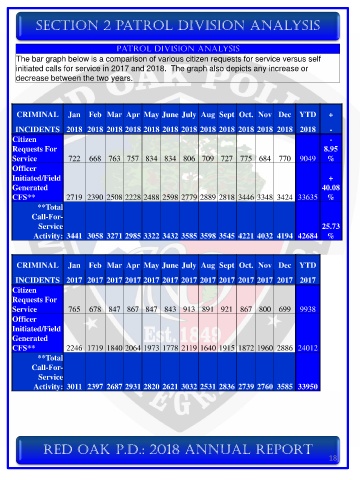
The bar graph below is a comparison of various citizen requests for service versus self
initiated calls for service in 2017 and 2018. The graph also depicts any increase or
decrease between the two years.
CRIMINAL Jan Feb Mar Apr May June July Aug Sept Oct. Nov Dec YTD +
INCIDENTS 2018 2018 2018 2018 2018 2018 2018 2018 2018 2018 2018 2018 2018 -
Citizen -
Requests For 8.95
Service 722 668 763 757 834 834 806 709 727 775 684 770 9049 %
Officer
Initiated/Field +
Generated 40.08
CFS** 2719 2390 2508 2228 2488 2598 2779 2889 2818 3446 3348 3424 33635 %
**Total
Call-For-
Service 25.73
Activity: 3441 3058 3271 2985 3322 3432 3585 3598 3545 4221 4032 4194 42684 %
CRIMINAL Jan Feb Mar Apr May June July Aug Sept Oct. Nov Dec YTD
INCIDENTS 2017 2017 2017 2017 2017 2017 2017 2017 2017 2017 2017 2017 2017
Citizen
Requests For
Service 765 678 847 867 847 843 913 891 921 867 800 699 9938
Officer
Initiated/Field
Generated
CFS** 2246 1719 1840 2064 1973 1778 2119 1640 1915 1872 1960 2886 24012
**Total
Call-For-
Service
Activity: 3011 2397 2687 2931 2820 2621 3032 2531 2836 2739 2760 3585 33950
Red Oak P.D.: 2018 ANNUAL REPORT
18