Page 105 - NobleCon19revC2_Neat
P. 105

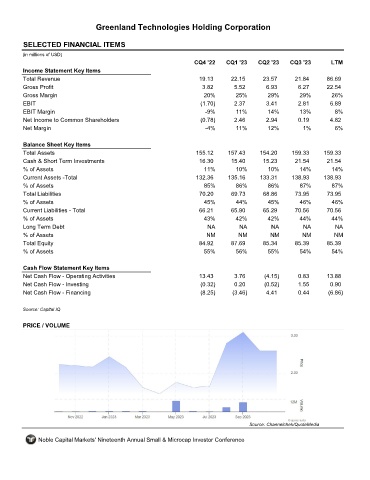
Greenland Technologies Holding Corporation


       SELECTED FINANCIAL ITEMS                                GTEC

      (in millions of USD)
                                                                  CQ4 '22    CQ1 '23    CQ2 '23    CQ3 '23        LTM
       Income Statement Key Items
       Total Revenue                                                19.13      22.15      23.57      21.84      86.69
       Gross Profit                                                  3.82       5.52       6.93       6.27      22.54
       Gross Margin                                                  20%         25%        29%        29%        26%
       EBIT                                                         (1.70)      2.37       3.41       2.81       6.89
       EBIT Margin                                                    -9%        11%        14%        13%         8%
       Net Income to Common Shareholders                            (0.78)      2.46       2.94       0.19       4.82
       Net Margin                                                     -4%        11%        12%         1%         6%


       Balance Sheet Key Items
       Total Assets                                                155.12     157.43     154.20     159.33     159.33
       Cash & Short Term Investments                                16.30      15.40      15.23      21.54      21.54
       % of Assets                                                    11%        10%        10%        14%        14%
       Current Assets -Total                                       132.36     135.16     133.31     138.93     138.93
       % of Assets                                                    85%        86%        86%        87%        87%
       Total Liabilities                                            70.20      69.73      68.86      73.95      73.95
       % of Assets                                                    45%        44%        45%        46%        46%
       Current Liabilities - Total                                  66.21      65.90      65.29      70.56      70.56
       % of Assets                                                   43%         42%        42%        44%        44%
       Long Term Debt                                                  NA         NA         NA         NA         NA
       % of Assets                                                    NM          NM         NM         NM         NM
       Total Equity                                                 84.92      87.69      85.34      85.39      85.39
       % of Assets                                                    55%        56%        55%        54%        54%


       Cash Flow Statement Key Items
       Net Cash Flow - Operating Activities                         13.43       3.76       (4.15)     0.83      13.88
       Net Cash Flow - Investing                                    (0.32)      0.20       (0.52)     1.55       0.90
       Net Cash Flow - Financing                                    (8.25)     (3.46)      4.41       0.44       (6.86)


      Source: Capital IQ

       PRICE / VOLUME


                                                                                     Source: Channelchek/QuoteMedia

            Noble Capital Markets' Nineteenth Annual Small & Microcap Investor Conference
   100   101   102   103   104   105   106   107   108   109   110