
Page 101 - NobleCon19revC2_Neat
P. 101
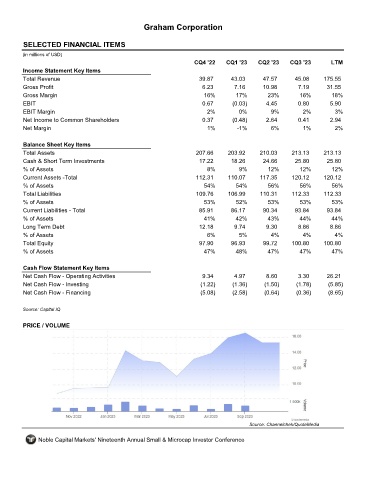
Graham Corporation


       SELECTED FINANCIAL ITEMS                                GHM

      (in millions of USD)
                                                                  CQ4 '22    CQ1 '23    CQ2 '23    CQ3 '23        LTM
       Income Statement Key Items
       Total Revenue                                                39.87      43.03      47.57      45.08     175.55
       Gross Profit                                                  6.23       7.16      10.98       7.19      31.55
       Gross Margin                                                  16%         17%        23%        16%        18%
       EBIT                                                          0.67      (0.03)      4.45       0.80       5.90
       EBIT Margin                                                     2%         0%         9%         2%         3%
       Net Income to Common Shareholders                             0.37      (0.48)      2.64       0.41       2.94
       Net Margin                                                      1%        -1%         6%         1%         2%


       Balance Sheet Key Items
       Total Assets                                                207.66     203.92     210.03     213.13     213.13
       Cash & Short Term Investments                                17.22      18.26      24.66      25.80      25.80
       % of Assets                                                     8%         9%        12%        12%        12%
       Current Assets -Total                                       112.31     110.07     117.35     120.12     120.12
       % of Assets                                                    54%        54%        56%        56%        56%
       Total Liabilities                                           109.76     106.99     110.31     112.33     112.33
       % of Assets                                                    53%        52%        53%        53%        53%
       Current Liabilities - Total                                  85.91      86.17      90.34      93.84      93.84
       % of Assets                                                   41%         42%        43%        44%        44%
       Long Term Debt                                               12.18       9.74       9.30       8.86       8.86
       % of Assets                                                     6%         5%         4%         4%         4%
       Total Equity                                                 97.90      96.93      99.72     100.80     100.80
       % of Assets                                                    47%        48%        47%        47%        47%


       Cash Flow Statement Key Items
       Net Cash Flow - Operating Activities                          9.34       4.97       8.60       3.30      26.21
       Net Cash Flow - Investing                                    (1.22)     (1.36)      (1.50)     (1.78)     (5.85)
       Net Cash Flow - Financing                                    (5.08)     (2.58)      (0.64)     (0.36)     (8.65)


      Source: Capital IQ

       PRICE / VOLUME


                                                                                     Source: Channelchek/QuoteMedia

            Noble Capital Markets' Nineteenth Annual Small & Microcap Investor Conference