
Page 99 - NobleCon19revC2_Neat
P. 99
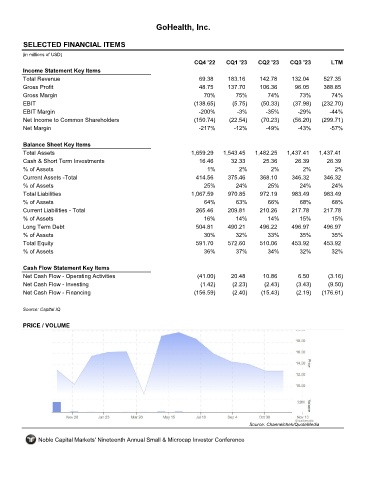
GoHealth, Inc.


       SELECTED FINANCIAL ITEMS                                GOCO

      (in millions of USD)
                                                                  CQ4 '22    CQ1 '23    CQ2 '23    CQ3 '23        LTM
       Income Statement Key Items
       Total Revenue                                                69.38     183.16     142.78     132.04     527.35
       Gross Profit                                                 48.75     137.70     106.36      96.05     388.85
       Gross Margin                                                  70%         75%        74%        73%        74%
       EBIT                                                       (138.65)     (5.75)    (50.33)     (37.98)   (232.70)
       EBIT Margin                                                  -200%        -3%       -35%       -29%       -44%
       Net Income to Common Shareholders                          (150.74)    (22.54)    (70.23)     (56.20)   (299.71)
       Net Margin                                                   -217%       -12%       -49%       -43%       -57%


       Balance Sheet Key Items
       Total Assets                                              1,659.29   1,543.45   1,482.25   1,437.41    1,437.41
       Cash & Short Term Investments                                16.46      32.33      25.36      26.39      26.39
       % of Assets                                                     1%         2%         2%         2%         2%
       Current Assets -Total                                       414.56     375.46     368.10     346.32     346.32
       % of Assets                                                    25%        24%        25%        24%        24%
       Total Liabilities                                         1,067.59     970.85     972.19     983.49     983.49
       % of Assets                                                    64%        63%        66%        68%        68%
       Current Liabilities - Total                                 265.46     209.81     210.26     217.78     217.78
       % of Assets                                                   16%         14%        14%        15%        15%
       Long Term Debt                                              504.81     490.21     496.22     496.97     496.97
       % of Assets                                                   30%         32%        33%        35%        35%
       Total Equity                                                591.70     572.60     510.06     453.92     453.92
       % of Assets                                                    36%        37%        34%        32%        32%


       Cash Flow Statement Key Items
       Net Cash Flow - Operating Activities                        (41.00)     20.48      10.86       6.50       (3.16)
       Net Cash Flow - Investing                                    (1.42)     (2.23)      (2.43)     (3.43)     (9.50)
       Net Cash Flow - Financing                                  (156.59)     (2.40)    (15.43)      (2.19)   (176.61)


      Source: Capital IQ

       PRICE / VOLUME


                                                                                     Source: Channelchek/QuoteMedia

            Noble Capital Markets' Nineteenth Annual Small & Microcap Investor Conference