Page 103 - NobleCon19revC2_Neat
P. 103

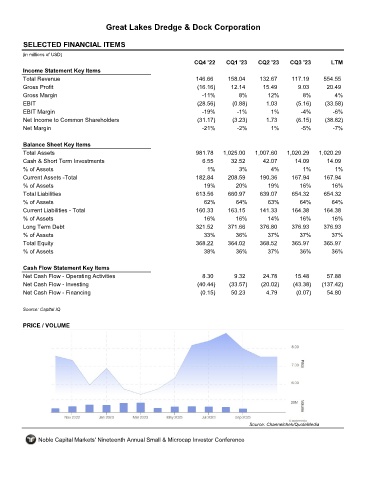
Great Lakes Dredge & Dock Corporation


       SELECTED FINANCIAL ITEMS                                GLDD

      (in millions of USD)
                                                                  CQ4 '22    CQ1 '23    CQ2 '23    CQ3 '23        LTM
       Income Statement Key Items
       Total Revenue                                               146.66     158.04     132.67     117.19     554.55
       Gross Profit                                                (16.16)     12.14      15.49       9.03      20.49
       Gross Margin                                                  -11%         8%        12%         8%         4%
       EBIT                                                        (28.56)     (0.88)      1.03       (5.16)    (33.58)
       EBIT Margin                                                   -19%        -1%         1%        -4%        -6%
       Net Income to Common Shareholders                           (31.17)     (3.23)      1.73       (6.15)    (38.82)
       Net Margin                                                    -21%        -2%         1%        -5%        -7%


       Balance Sheet Key Items
       Total Assets                                                981.78   1,025.00   1,007.60   1,020.29    1,020.29
       Cash & Short Term Investments                                 6.55      32.52      42.07      14.09      14.09
       % of Assets                                                     1%         3%         4%         1%         1%
       Current Assets -Total                                       182.84     208.59     190.36     167.94     167.94
       % of Assets                                                    19%        20%        19%        16%        16%
       Total Liabilities                                           613.56     660.97     639.07     654.32     654.32
       % of Assets                                                    62%        64%        63%        64%        64%
       Current Liabilities - Total                                 160.33     163.15     141.33     164.38     164.38
       % of Assets                                                   16%         16%        14%        16%        16%
       Long Term Debt                                              321.52     371.66     376.80     376.93     376.93
       % of Assets                                                   33%         36%        37%        37%        37%
       Total Equity                                                368.22     364.02     368.52     365.97     365.97
       % of Assets                                                    38%        36%        37%        36%        36%


       Cash Flow Statement Key Items
       Net Cash Flow - Operating Activities                          8.30       9.32      24.78      15.48      57.88
       Net Cash Flow - Investing                                   (40.44)    (33.57)    (20.02)     (43.38)   (137.42)
       Net Cash Flow - Financing                                    (0.15)     50.23       4.79       (0.07)    54.80


      Source: Capital IQ

       PRICE / VOLUME


                                                                                     Source: Channelchek/QuoteMedia

            Noble Capital Markets' Nineteenth Annual Small & Microcap Investor Conference
   98   99   100   101   102   103   104   105   106   107   108