
Page 135 - NobleCon19revC2_Neat
P. 135
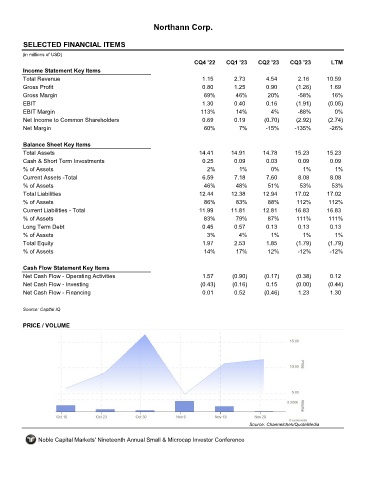
Northann Corp.


       SELECTED FINANCIAL ITEMS                                NCL

      (in millions of USD)
                                                                  CQ4 '22    CQ1 '23    CQ2 '23    CQ3 '23        LTM
       Income Statement Key Items
       Total Revenue                                                 1.15       2.73       4.54       2.16      10.59
       Gross Profit                                                  0.80       1.25       0.90       (1.26)     1.69
       Gross Margin                                                  69%         46%        20%       -58%        16%
       EBIT                                                          1.30       0.40       0.16       (1.91)     (0.05)
       EBIT Margin                                                  113%         14%         4%       -88%         0%
       Net Income to Common Shareholders                             0.69       0.19       (0.70)     (2.92)     (2.74)
       Net Margin                                                     60%         7%       -15%      -135%       -26%


       Balance Sheet Key Items
       Total Assets                                                 14.41      14.91      14.78      15.23      15.23
       Cash & Short Term Investments                                 0.25       0.09       0.03       0.09       0.09
       % of Assets                                                     2%         1%         0%         1%         1%
       Current Assets -Total                                         6.59       7.18       7.60       8.08       8.08
       % of Assets                                                    46%        48%        51%        53%        53%
       Total Liabilities                                            12.44      12.38      12.94      17.02      17.02
       % of Assets                                                    86%        83%        88%       112%       112%
       Current Liabilities - Total                                  11.99      11.81      12.81      16.83      16.83
       % of Assets                                                   83%         79%        87%       111%       111%
       Long Term Debt                                                0.45       0.57       0.13       0.13       0.13
       % of Assets                                                     3%         4%         1%         1%         1%
       Total Equity                                                  1.97       2.53       1.85       (1.79)     (1.79)
       % of Assets                                                    14%        17%        12%       -12%       -12%


       Cash Flow Statement Key Items
       Net Cash Flow - Operating Activities                          1.57      (0.90)      (0.17)     (0.38)     0.12
       Net Cash Flow - Investing                                    (0.43)     (0.16)      0.15       (0.00)     (0.44)
       Net Cash Flow - Financing                                     0.01       0.52       (0.46)     1.23       1.30


      Source: Capital IQ

       PRICE / VOLUME


                                                                                     Source: Channelchek/QuoteMedia

            Noble Capital Markets' Nineteenth Annual Small & Microcap Investor Conference