Page 137 - NobleCon19revC2_Neat
P. 137

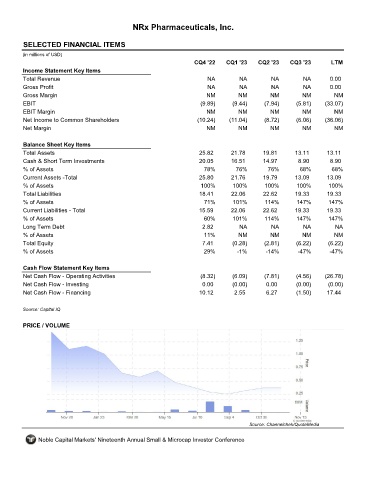
NRx Pharmaceuticals, Inc.


       SELECTED FINANCIAL ITEMS                                NRXP

      (in millions of USD)
                                                                  CQ4 '22    CQ1 '23    CQ2 '23    CQ3 '23        LTM
       Income Statement Key Items
       Total Revenue                                                   NA         NA         NA         NA       0.00
       Gross Profit                                                    NA         NA         NA         NA       0.00
       Gross Margin                                                   NM          NM         NM         NM         NM
       EBIT                                                         (9.89)     (9.44)      (7.94)     (5.81)    (33.07)
       EBIT Margin                                                    NM          NM         NM         NM         NM
       Net Income to Common Shareholders                           (10.24)    (11.04)      (8.72)     (6.06)    (36.06)
       Net Margin                                                     NM          NM         NM         NM         NM


       Balance Sheet Key Items
       Total Assets                                                 25.82      21.78      19.81      13.11      13.11
       Cash & Short Term Investments                                20.05      16.51      14.97       8.90       8.90
       % of Assets                                                    78%        76%        76%        68%        68%
       Current Assets -Total                                        25.80      21.76      19.79      13.09      13.09
       % of Assets                                                  100%        100%       100%       100%       100%
       Total Liabilities                                            18.41      22.06      22.62      19.33      19.33
       % of Assets                                                    71%       101%       114%       147%       147%
       Current Liabilities - Total                                  15.59      22.06      22.62      19.33      19.33
       % of Assets                                                   60%       101%        114%       147%       147%
       Long Term Debt                                                2.82         NA         NA         NA         NA
       % of Assets                                                   11%          NM         NM         NM         NM
       Total Equity                                                  7.41      (0.28)      (2.81)     (6.22)     (6.22)
       % of Assets                                                    29%        -1%       -14%       -47%       -47%


       Cash Flow Statement Key Items
       Net Cash Flow - Operating Activities                         (8.32)     (6.09)      (7.81)     (4.56)    (26.78)
       Net Cash Flow - Investing                                     0.00      (0.00)      0.00       (0.00)     (0.00)
       Net Cash Flow - Financing                                    10.12       2.55       6.27       (1.50)    17.44


      Source: Capital IQ

       PRICE / VOLUME


                                                                                     Source: Channelchek/QuoteMedia

            Noble Capital Markets' Nineteenth Annual Small & Microcap Investor Conference
   132   133   134   135   136   137   138   139   140   141   142