
Page 141 - NobleCon19revC2_Neat
P. 141
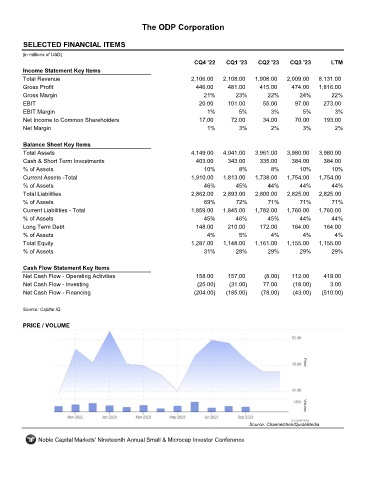
The ODP Corporation


       SELECTED FINANCIAL ITEMS                                ODP

      (in millions of USD)
                                                                  CQ4 '22    CQ1 '23    CQ2 '23    CQ3 '23        LTM
       Income Statement Key Items
       Total Revenue                                             2,106.00   2,108.00   1,908.00   2,009.00    8,131.00
       Gross Profit                                                446.00     481.00     415.00     474.00    1,816.00
       Gross Margin                                                  21%         23%        22%        24%        22%
       EBIT                                                         20.00     101.00      55.00      97.00     273.00
       EBIT Margin                                                     1%         5%         3%         5%         3%
       Net Income to Common Shareholders                            17.00      72.00      34.00      70.00     193.00
       Net Margin                                                      1%         3%         2%         3%         2%


       Balance Sheet Key Items
       Total Assets                                              4,149.00   4,041.00   3,961.00   3,980.00    3,980.00
       Cash & Short Term Investments                               403.00     343.00     335.00     384.00     384.00
       % of Assets                                                    10%         8%         8%        10%        10%
       Current Assets -Total                                     1,910.00   1,813.00   1,738.00   1,754.00    1,754.00
       % of Assets                                                    46%        45%        44%        44%        44%
       Total Liabilities                                         2,862.00   2,893.00   2,800.00   2,825.00    2,825.00
       % of Assets                                                    69%        72%        71%        71%        71%
       Current Liabilities - Total                               1,859.00   1,845.00   1,782.00   1,760.00    1,760.00
       % of Assets                                                   45%         46%        45%        44%        44%
       Long Term Debt                                              148.00     210.00     172.00     164.00     164.00
       % of Assets                                                     4%         5%         4%         4%         4%
       Total Equity                                              1,287.00   1,148.00   1,161.00   1,155.00    1,155.00
       % of Assets                                                    31%        28%        29%        29%        29%


       Cash Flow Statement Key Items
       Net Cash Flow - Operating Activities                        158.00     157.00       (8.00)   112.00     419.00
       Net Cash Flow - Investing                                   (25.00)    (31.00)     77.00      (18.00)     3.00
       Net Cash Flow - Financing                                  (204.00)   (185.00)    (78.00)     (43.00)   (510.00)


      Source: Capital IQ

       PRICE / VOLUME


                                                                                     Source: Channelchek/QuoteMedia

            Noble Capital Markets' Nineteenth Annual Small & Microcap Investor Conference