Page 147 - NobleCon19revC2_Neat
P. 147

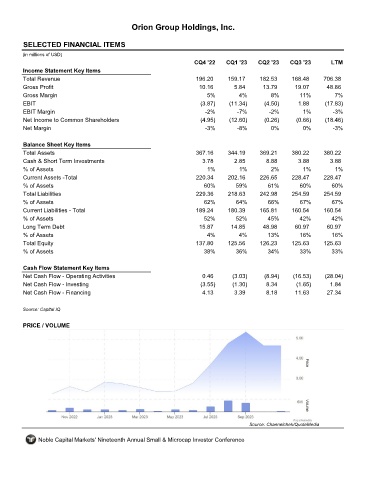
Orion Group Holdings, Inc.


       SELECTED FINANCIAL ITEMS                                ORN

      (in millions of USD)
                                                                  CQ4 '22    CQ1 '23    CQ2 '23    CQ3 '23        LTM
       Income Statement Key Items
       Total Revenue                                               196.20     159.17     182.53     168.48     706.38
       Gross Profit                                                 10.16       5.84      13.79      19.07      48.86
       Gross Margin                                                    5%         4%         8%        11%         7%
       EBIT                                                         (3.87)    (11.34)      (4.50)     1.88      (17.83)
       EBIT Margin                                                    -2%        -7%        -2%         1%        -3%
       Net Income to Common Shareholders                            (4.95)    (12.60)      (0.26)     (0.66)    (18.46)
       Net Margin                                                     -3%        -8%         0%         0%        -3%


       Balance Sheet Key Items
       Total Assets                                                367.16     344.19     369.21     380.22     380.22
       Cash & Short Term Investments                                 3.78       2.85       8.88       3.88       3.88
       % of Assets                                                     1%         1%         2%         1%         1%
       Current Assets -Total                                       220.34     202.16     226.65     228.47     228.47
       % of Assets                                                    60%        59%        61%        60%        60%
       Total Liabilities                                           229.36     218.63     242.98     254.59     254.59
       % of Assets                                                    62%        64%        66%        67%        67%
       Current Liabilities - Total                                 189.24     180.39     165.81     160.54     160.54
       % of Assets                                                   52%         52%        45%        42%        42%
       Long Term Debt                                               15.87      14.85      48.98      60.97      60.97
       % of Assets                                                     4%         4%        13%        16%        16%
       Total Equity                                                137.80     125.56     126.23     125.63     125.63
       % of Assets                                                    38%        36%        34%        33%        33%


       Cash Flow Statement Key Items
       Net Cash Flow - Operating Activities                          0.46      (3.03)      (8.94)    (16.53)    (28.04)
       Net Cash Flow - Investing                                    (3.55)     (1.30)      8.34       (1.65)     1.84
       Net Cash Flow - Financing                                     4.13       3.39       8.18      11.63      27.34


      Source: Capital IQ

       PRICE / VOLUME


                                                                                     Source: Channelchek/QuoteMedia

            Noble Capital Markets' Nineteenth Annual Small & Microcap Investor Conference
   142   143   144   145   146   147   148   149   150   151   152