Page 149 - NobleCon19revC2_Neat
P. 149

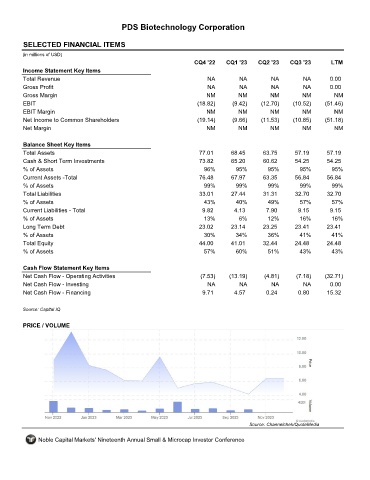
PDS Biotechnology Corporation


       SELECTED FINANCIAL ITEMS                                PDSB

      (in millions of USD)
                                                                  CQ4 '22    CQ1 '23    CQ2 '23    CQ3 '23        LTM
       Income Statement Key Items
       Total Revenue                                                   NA         NA         NA         NA       0.00
       Gross Profit                                                    NA         NA         NA         NA       0.00
       Gross Margin                                                   NM          NM         NM         NM         NM
       EBIT                                                        (18.82)     (9.42)    (12.70)     (10.52)    (51.46)
       EBIT Margin                                                    NM          NM         NM         NM         NM
       Net Income to Common Shareholders                           (19.14)     (9.66)    (11.53)     (10.85)    (51.18)
       Net Margin                                                     NM          NM         NM         NM         NM


       Balance Sheet Key Items
       Total Assets                                                 77.01      68.45      63.75      57.19      57.19
       Cash & Short Term Investments                                73.82      65.20      60.62      54.25      54.25
       % of Assets                                                    96%        95%        95%        95%        95%
       Current Assets -Total                                        76.48      67.97      63.35      56.84      56.84
       % of Assets                                                    99%        99%        99%        99%        99%
       Total Liabilities                                            33.01      27.44      31.31      32.70      32.70
       % of Assets                                                    43%        40%        49%        57%        57%
       Current Liabilities - Total                                   9.82       4.13       7.90       9.15       9.15
       % of Assets                                                   13%          6%        12%        16%        16%
       Long Term Debt                                               23.02      23.14      23.25      23.41      23.41
       % of Assets                                                   30%         34%        36%        41%        41%
       Total Equity                                                 44.00      41.01      32.44      24.48      24.48
       % of Assets                                                    57%        60%        51%        43%        43%


       Cash Flow Statement Key Items
       Net Cash Flow - Operating Activities                         (7.53)    (13.19)      (4.81)     (7.18)    (32.71)
       Net Cash Flow - Investing                                       NA         NA         NA         NA       0.00
       Net Cash Flow - Financing                                     9.71       4.57       0.24       0.80      15.32


      Source: Capital IQ

       PRICE / VOLUME


                                                                                     Source: Channelchek/QuoteMedia

            Noble Capital Markets' Nineteenth Annual Small & Microcap Investor Conference
   144   145   146   147   148   149   150   151   152   153   154