
Page 15 - 2015 Key Metrics-Assessing ECP Practice Performance
P. 15
practices generate more revenue per unit of space by seeing more patients, earning more from each patient seen, and more efficient
space utilization. Patient traffic and revenue are able to grow substantially in many practices with no addition to office space, yielding
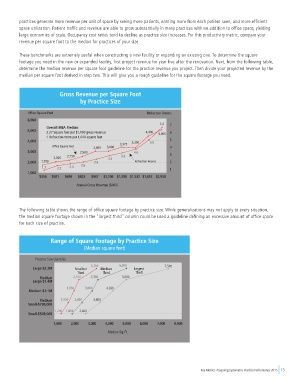
large economies of scale. Occupancy cost ratios tend to decline as practice size increases. For this productivity metric, compare your
revenue per square foot to the median for practices of your size.
These benchmarks are extremely useful when constructing a new facility or expanding an existing one. To determine the square
footage you need in the new or expanded facility, first project revenue for year five after the renovation. Next, from the following table,
determine the median revenue per square foot guideline for the practice revenue you project. Then divide your projected revenue by the
median per square foot derived in step two. This will give you a rough guideline for the square footage you need.
Gross Revenue per Square Foot
by Practice Size
Office Square Feet Refraction Rooms
6,000
6.4 7
Overall MBA Median:
5,000 2.27 Square feet per $1,000 gross revenue 4,400 5,000 6
1 Refraction room per 1,000 square feet
4,000 3,300 5.0 5
Office Square Feet 3,000 3,000 3,375 4
3,000 2,500 4.0
2,000 2,150 3.3 3.6 3
2,000 1,700 2.9 Refraction Rooms 2
1.7 2.2 2.4 2.6 1
1,000
$356 $581 $698 $823 $947 $1,106 $1,300 $1,532 $1,852 $2,950
Annual Gross Revenue ($000)
The following table shows the range of office square footage by practice size. While generalizations may not apply to every situation,
the median square footage shown in the “largest third” column could be used a guideline defining an excessive amount of office space
for each size of practice.
Range of Square Footage by Practice Size
(Median square feet)
Practice Size Quintiles
3,250 5,000 7,500
Large-$2.2M Smallest Medium Largest
Third Third Third
Medium 2,150 3,300 5,000
Large-$1.4M
1,950 3,000 4,200
Medium-$1.1M
Medium 1,600 2,400 3,400
Small-$790,000
1,200 1,800 2,600
Small-$509,000
1,000 2,000 3,000 4,000 5,000 6,000 7,000 8,000
Median Sq. Ft.
Key Metrics: Assessing Optometric Practice Performance 2015 13