
Page 20 - 2015 Key Metrics-Assessing ECP Practice Performance
P. 20
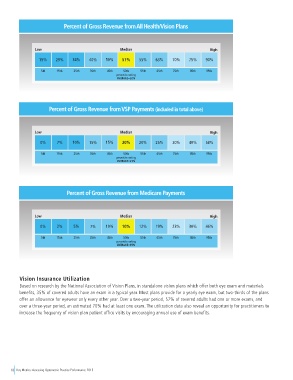
Percent of Gross Revenue from All Health/Vision Plans


                Low                                Median                                High

                 15%    29%    34%    40%    50%    51%    55%    63%    70%    75%    90%

                    5th              15th              25th             35th              45th             50th              55th             65th             75th              85th             95th
                                                  percentile ranking
                                                  AVERAGE=52%


                      Percent of Gross Revenue from VSP Payments (included in total above)


                Low                                Median                                High
                  0%     7%    10%    15%    15%    20%    20%    25%    30%    40%    58%


                    5th              15th              25th             35th              45th             50th              55th             65th             75th              85th             95th
                                                  percentile ranking
                                                  AVERAGE=21%


                             Percent of Gross Revenue from Medicare Payments


                Low                                Median                                High
                  0%     2%     5%     7%    10%    10%    12%    19%    23%    30%    46%

                    5th              15th              25th             35th              45th             50th              55th             65th             75th              85th             95th
                                                  percentile ranking
                                                  AVERAGE=15%


         Vision Insurance Utilization
         Based on research by the National Association of Vision Plans, in standalone vision plans which offer both eye exam and materials
         benefits, 35% of covered adults have an exam in a typical year. Most plans provide for a yearly eye exam, but two-thirds of the plans
         offer an allowance for eyewear only every other year. Over a two-year period, 57% of covered adults had one or more exams, and
         over a three-year period, an estimated 70% had at least one exam. The utilization data also reveal an opportunity for practitioners to
         increase the frequency of vision plan patient office visits by encouraging annual use of exam benefits.


     18  Key Metrics: Assessing Optometric Practice Performance 2015