
Page 6 - 2015 Key Metrics-Assessing ECP Practice Performance
P. 6
Independent OD Performance in Primary Eyecare Market
This section describes the market context in which independent ODs operate, providing background on the growth rate in primary eyecare
demand and independents’ market share and capture rate of patients’ device purchases.
Based on AOA estimates, of the 40,000 ODs practicing in the U.S., 22,800 work in practices owned by independent ODs with no corporate affiliation.
Practice Advancement Associates estimate that there are approximately 14,000-16,000 independent OD practices in operation in the U.S.
The VIsion Council conducts on-going consumer research monitoring demand for eye exams and vision correction devices, called VisionWatch.
These surveys provide the best available monitor of primary eyecare consumption trends.
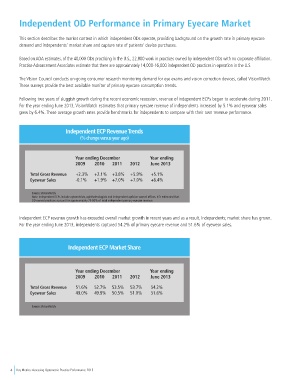
Following two years of sluggish growth during the recent economic recession, revenue of independent ECPs began to accelerate during 2011.
For the year ending June 2013, VisionWatch estimates that primary eyecare revenue of independents increased by 5.1% and eyewear sales
grew by 6.4%. These average growth rates provide benchmarks for independents to compare with their own revenue performance.
Independent ECP Revenue Trends
(% change versus year ago)
Year ending December Year ending
2009 2010 2011 2012 June 2013
Total Gross Revenue +2.3% +2.1% +3.8% +5.9% +5.1%
Eyewear Sales -0.1% +1.9% +7.0% +7.0% +6.4%
Source: VisionWatch
Note: Independent ECPs include optometrists, ophthalmologists and independent optician-owned offices. It is estimated that
OD-owned practices account for approximately 75-80% of total independent primary eyecare revenue.
Independent ECP revenue growth has exceeded overall market growth in recent years and as a result, independents; market share has grown.
For the year ending June 2013, independents captured 54.2% of primary eyecare revenue and 51.6% of eyewear sales.
Independent ECP Market Share
Year ending December Year ending
2009 2010 2011 2012 June 2013
Total Gross Revenue 51.6% 52.7% 53.5% 53.7% 54.2%
Eyewear Sales 49.0% 49.9% 50.5% 51.0% 51.6%
Source: VisionWatch
4 Key Metrics: Assessing Optometric Practice Performance 2015