
Page 1562 - draft
P. 1562
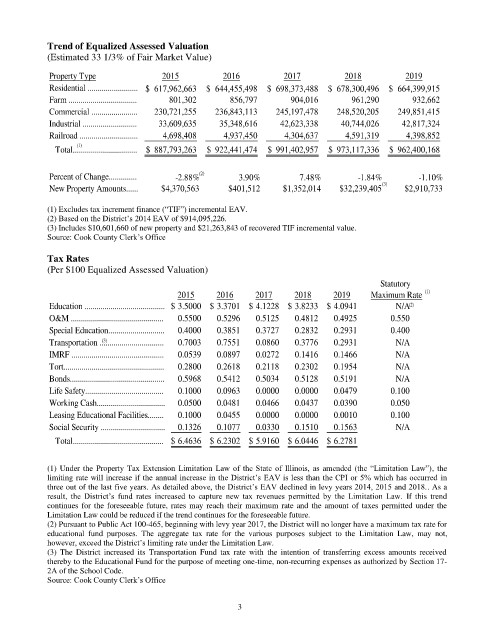
Trend of Equalized Assessed Valuation
             (Estimated 33 1/3% of Fair Market Value)

             Property Type               2015           2016           2017           2018           2019
             Residential ......................... $    617,962,663  $    644,455,498  $    698,373,488  $    678,300,496  $    664,399,915
             Farm ..................................               801,302                856,797                904,016                961,290                932,662
             Commercial .......................       230,721,255        236,843,113        245,197,478        248,520,205        249,851,415
             Industrial ...........................          33,609,635          35,348,616          42,623,338          40,744,026          42,817,324
             Railroad .............................            4,698,408            4,937,450            4,304,637            4,591,319            4,398,852
                    (1)
               Total................................ $    887,793,263  $    922,441,474  $    991,402,957  $    973,117,336  $    962,400,168

             Percent of Change..............  -2.88% (2)    3.90%          7.48%          -1.84%         -1.10%
             New Property Amounts......  $4,370,563       $401,512     $1,352,014    $32,239,405 (3)  $2,910,733

             (1) Excludes tax increment finance (“TIF”) incremental EAV.
             (2) Based on the District’s 2014 EAV of $914,095,226.
             (3) Includes $10,601,660 of new property and $21,263,843 of recovered TIF incremental value.
             Source: Cook County Clerk’s Office

             Tax Rates
             (Per $100 Equalized Assessed Valuation)
                                                                                               Statutory
                                             2015      2016     2017      2018      2019     Maximum Rate  (1)
             Education ........................................ $   3.5000 $   3.3701 $   4.1228 $   3.8233 $   4.0941  N/A (2)
             O&M ..............................................      0.5500      0.5296      0.5125      0.4812      0.4925  0.550
             Special Education............................      0.4000      0.3851      0.3727      0.2832      0.2931  0.400
             Transportation ................................      0.7003      0.7551      0.0860      0.3776      0.2931  N/A
                          (3)
             IMRF ..............................................      0.0539      0.0897      0.0272      0.1416      0.1466  N/A
             Tort..................................................      0.2800      0.2618      0.2118      0.2302      0.1954  N/A
             Bonds...............................................      0.5968      0.5412      0.5034      0.5128      0.5191  N/A
             Life Safety.......................................      0.1000      0.0963      0.0000      0.0000      0.0479  0.100
             Working Cash..................................      0.0500      0.0481      0.0466      0.0437      0.0390  0.050
             Leasing Educational Facilities........      0.1000      0.0455      0.0000      0.0000      0.0010  0.100
             Social Security ................................      0.1326      0.1077      0.0330      0.1510      0.1563  N/A
               Total............................................. $   6.4636 $   6.2302 $   5.9160 $   6.0446 $   6.2781


             (1) Under the Property Tax Extension Limitation Law of the State of Illinois, as amended (the “Limitation Law”), the
             limiting rate will increase if the annual increase in the District’s EAV is less than the CPI or 5% which has occurred  in
             three out of the last five years. As detailed above, the District’s EAV declined in levy years 2014, 2015 and 2018.. As a
             result,  the  District’s  fund  rates  increased  to  capture  new  tax  revenues  permitted  by  the  Limitation  Law.  If  this  trend
             continues for the foreseeable future, rates may reach their maximum rate and the amount of taxes permitted under the
             Limitation Law could be reduced if the trend continues for the foreseeable future.
             (2) Pursuant to Public Act 100-465, beginning with levy year 2017, the District will no longer have a maximum tax rate for
             educational  fund  purposes.  The  aggregate  tax  rate  for  the  various  purposes  subject  to  the  Limitation  Law,  may  not,
             however, exceed the District’s limiting rate under the Limitation Law.
             (3)  The  District  increased  its  Transportation  Fund  tax  rate  with  the  intention  of  transferring  excess  amounts  received
             thereby to the Educational Fund for the purpose of meeting one-time, non-recurring expenses as authorized by Section 17-
             2A of the School Code.
             Source: Cook County Clerk’s Office


                                                            3