
Page 1640 - draft
P. 1640
U.S. PUBLIC FINANCE
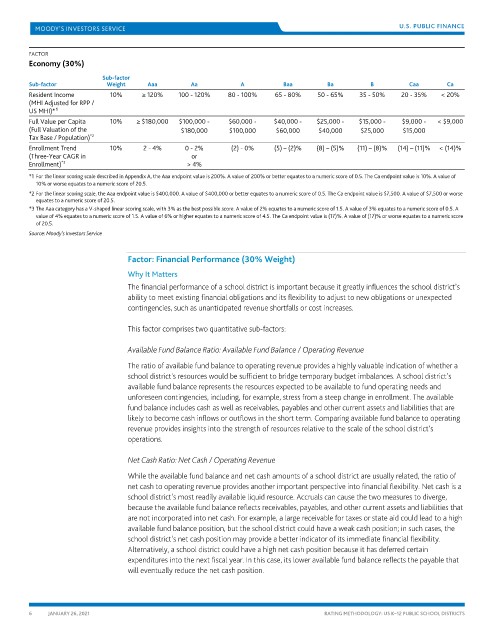
FACTOR
Economy (30%)
Sub-factor
Sub-factor Weight Aaa Aa A Baa Ba B Caa Ca
Resident Income 10% ≥ 120% 100 - 120% 80 - 100% 65 - 80% 50 - 65% 35 - 50% 20 - 35% < 20%
(MHI Adjusted for RPP /
1
US MHI)*
Full Value per Capita 10% ≥ $180,000 $100,000 - $60,000 - $40,000 - $25,000 - $15,000 - $9,000 - < $9,000
(Full Valuation of the $180,000 $100,000 $60,000 $40,000 $25,000 $15,000
*2
Tax Base / Population)
Enrollment Trend 10% 2 - 4% 0 - 2% (2) - 0% (5) – (2)% (8) – (5)% (11) – (8)% (14) – (11)% < (14)%
(Three-Year CAGR in or
*3
Enrollment) > 4%
*1 For the linear scoring scale described in Appendix A, the Aaa endpoint value is 200%. A value of 200% or better equates to a numeric score of 0.5. The Ca endpoint value is 10%. A value of
10% or worse equates to a numeric score of 20.5.
*2 For the linear scoring scale, the Aaa endpoint value is $400,000. A value of $400,000 or better equates to a numeric score of 0.5. The Ca endpoint value is $7,500. A value of $7,500 or worse
equates to a numeric score of 20.5.
*3 The Aaa category has a V-shaped linear scoring scale, with 3% as the best possible score. A value of 2% equates to a numeric score of 1.5. A value of 3% equates to a numeric score of 0.5. A
value of 4% equates to a numeric score of 1.5. A value of 6% or higher equates to a numeric score of 4.5. The Ca endpoint value is (17)%. A value of (17)% or worse equates to a numeric score
of 20.5.
Source: Moody’s Investors Service
Factor: Financial Performance (30% Weight)
Why It Matters
The financial performance of a school district is important because it greatly influences the school district’s
ability to meet existing financial obligations and its flexibility to adjust to new obligations or unexpected
contingencies, such as unanticipated revenue shortfalls or cost increases.
This factor comprises two quantitative sub-factors:
Available Fund Balance Ratio: Available Fund Balance / Operating Revenue
The ratio of available fund balance to operating revenue provides a highly valuable indication of whether a
school district's resources would be sufficient to bridge temporary budget imbalances. A school district’s
available fund balance represents the resources expected to be available to fund operating needs and
unforeseen contingencies, including, for example, stress from a steep change in enrollment. The available
fund balance includes cash as well as receivables, payables and other current assets and liabilities that are
likely to become cash inflows or outflows in the short term. Comparing available fund balance to operating
revenue provides insights into the strength of resources relative to the scale of the school district’s
operations.
Net Cash Ratio: Net Cash / Operating Revenue
While the available fund balance and net cash amounts of a school district are usually related, the ratio of
net cash to operating revenue provides another important perspective into financial flexibility. Net cash is a
school district’s most readily available liquid resource. Accruals can cause the two measures to diverge,
because the available fund balance reflects receivables, payables, and other current assets and liabilities that
are not incorporated into net cash. For example, a large receivable for taxes or state aid could lead to a high
available fund balance position, but the school district could have a weak cash position; in such cases, the
school district’s net cash position may provide a better indicator of its immediate financial flexibility.
Alternatively, a school district could have a high net cash position because it has deferred certain
expenditures into the next fiscal year. In this case, its lower available fund balance reflects the payable that
will eventually reduce the net cash position.
6 JANUARY 26, 2021 RATING METHODOLOGY: US K–12 PUBLIC SCHOOL DISTRICTS