
Page 1642 - draft
P. 1642
U.S. PUBLIC FINANCE
FACTOR
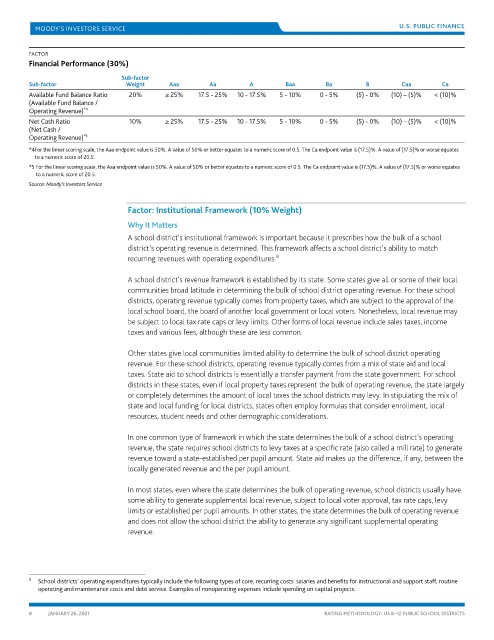
Financial Performance (30%)
Sub-factor
Sub-factor Weight Aaa Aa A Baa Ba B Caa Ca
Available Fund Balance Ratio 20% ≥ 25% 17.5 - 25% 10 - 17.5% 5 - 10% 0 - 5% (5) - 0% (10) – (5)% < (10)%
(Available Fund Balance /
*4
Operating Revenue)
Net Cash Ratio 10% ≥ 25% 17.5 - 25% 10 - 17.5% 5 - 10% 0 - 5% (5) - 0% (10) – (5)% < (10)%
(Net Cash /
Operating Revenue)
*5
*4 For the linear scoring scale, the Aaa endpoint value is 50%. A value of 50% or better equates to a numeric score of 0.5. The Ca endpoint value is (17.5)%. A value of (17.5)% or worse equates
to a numeric score of 20.5.
*5 For the linear scoring scale, the Aaa endpoint value is 50%. A value of 50% or better equates to a numeric score of 0.5. The Ca endpoint value is (17.5)%. A value of (17.5)% or worse equates
to a numeric score of 20.5.
Source: Moody’s Investors Service
Factor: Institutional Framework (10% Weight)
Why It Matters
A school district’s institutional framework is important because it prescribes how the bulk of a school
district’s operating revenue is determined. This framework affects a school district’s ability to match
9
recurring revenues with operating expenditures.
A school district’s revenue framework is established by its state. Some states give all or some of their local
communities broad latitude in determining the bulk of school district operating revenue. For these school
districts, operating revenue typically comes from property taxes, which are subject to the approval of the
local school board, the board of another local government or local voters. Nonetheless, local revenue may
be subject to local tax rate caps or levy limits. Other forms of local revenue include sales taxes, income
taxes and various fees, although these are less common.
Other states give local communities limited ability to determine the bulk of school district operating
revenue. For these school districts, operating revenue typically comes from a mix of state aid and local
taxes. State aid to school districts is essentially a transfer payment from the state government. For school
districts in these states, even if local property taxes represent the bulk of operating revenue, the state largely
or completely determines the amount of local taxes the school districts may levy. In stipulating the mix of
state and local funding for local districts, states often employ formulas that consider enrollment, local
resources, student needs and other demographic considerations.
In one common type of framework in which the state determines the bulk of a school district’s operating
revenue, the state requires school districts to levy taxes at a specific rate (also called a mill rate) to generate
revenue toward a state-established per pupil amount. State aid makes up the difference, if any, between the
locally generated revenue and the per pupil amount.
In most states, even where the state determines the bulk of operating revenue, school districts usually have
some ability to generate supplemental local revenue, subject to local voter approval, tax rate caps, levy
limits or established per pupil amounts. In other states, the state determines the bulk of operating revenue
and does not allow the school district the ability to generate any significant supplemental operating
revenue.
9 School districts’ operating expenditures typically include the following types of core, recurring costs: salaries and benefits for instructional and support staff, routine
operating and maintenance costs and debt service. Examples of nonoperating expenses include spending on capital projects.
8 JANUARY 26, 2021 RATING METHODOLOGY: US K–12 PUBLIC SCHOOL DISTRICTS