
Page 1647 - draft
P. 1647
U.S. PUBLIC FINANCE
OPEB Contributions
The input to the fixed-costs ratio for OPEBs is a school district’s actual contribution in a given period,
typically the fiscal year. In the event a school district issues pension or OPEB funding bonds, the deposit of
the proceeds into a retirement system or trust is not considered a contribution in our analysis of fixed costs,
nor in our analysis of pension contributions relative to the pension tread water indicator.
FACTOR
Leverage (30%)
Sub-factor
Sub-factor Weight Aaa Aa A Baa Ba B Caa Ca
Long-term Liabilities Ratio 20% ≤ 125% 125 - 250% 250 - 400 - 550 - 700 - 850 – > 1,000%
((Debt + Adjusted Net Pension 400% 550% 700% 850% 1,000%
Liabilities + Adjusted Net Other
Post-Employment Benefits) /
*6
Operating Revenue)
Fixed-Costs Ratio 10% ≤ 15% 15 - 20% 20 - 25% 25 - 30% 30 - 35% 35 - 45% 45 - 55% > 55%
(Adjusted Fixed Costs /
*7
Operating Revenue)
*6 For the linear scoring scale, the Aaa endpoint value is 0%. A value of 0% or better equates to a numeric score of 0.5. The Ca endpoint value is 1,250%. A value of 1,250% or worse equates to a
numeric score of 20.5.
*7 For the linear scoring scale, the Aaa endpoint value is 0%. A value of 0% or better equates to a numeric score of 0.5. The Ca endpoint value is 65%. A value of 65% or worse equates to a
numeric score of 20.5.
Source: Moody’s Investors Service
Notching Factors
The scorecard includes notching factors. Our assessment of these notching factors may result in upward or
downward adjustments to the preliminary outcome that results from the four weighted scorecard factors.
Adjustments may be made in half-notch or whole-notch increments based on the notching factors listed in
the table below.
In aggregate, the notching factors can result in a total of up to four and one-half upward notches or up to
six downward notches from the preliminary outcome to arrive at the scorecard-indicated outcome. In cases
where we consider that the credit weakness or credit strength represented by a notching factor, or by these
factors in aggregate, is greater than the scorecard range, we incorporate this view into the school district’s
rating, which may be different from the scorecard-indicated outcome.
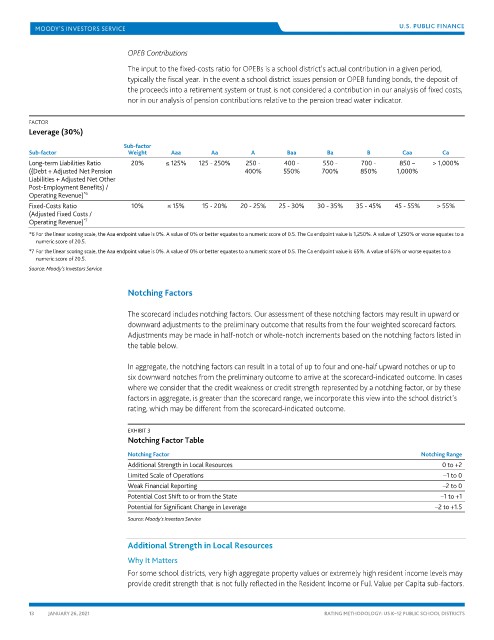
EXHIBIT 3
Notching Factor Table
Notching Factor Notching Range
Additional Strength in Local Resources 0 to +2
Limited Scale of Operations –1 to 0
Weak Financial Reporting –2 to 0
Potential Cost Shift to or from the State –1 to +1
Potential for Significant Change in Leverage –2 to +1.5
Source: Moody’s Investors Service
Additional Strength in Local Resources
Why It Matters
For some school districts, very high aggregate property values or extremely high resident income levels may
provide credit strength that is not fully reflected in the Resident Income or Full Value per Capita sub-factors.
13 JANUARY 26, 2021 RATING METHODOLOGY: US K–12 PUBLIC SCHOOL DISTRICTS