
Page 11 - CvSU Trece Campus Enrollment History
P. 11
A
V
IT
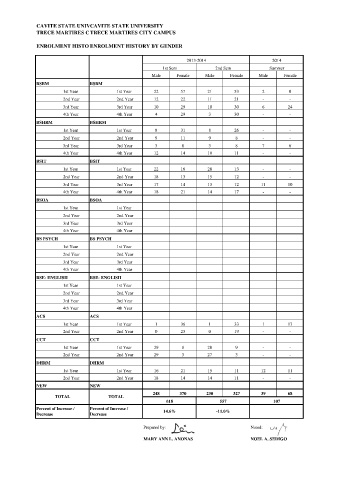
CAVITE STATE UNIVERSITYE STATE UNIVERSITY
C
M
T
R
A
C
R
TRECE MARTIRES CITY CAMPUSTIRES CITY CAMPUS
E
E
E
N
M
E
O
L
R
ENROLMENT HISTORY BY GENDERHISTORY BY GENDER
N
T
2013-2014 2014
1st Sem 2nd Sem Summer
Male Female Male Female Male Female
BSBM BSBM
1st Year 1st Year 22 57 21 53 2 0
2nd Year 2nd Year 12 22 11 21 - -
3rd Year 3rd Year 10 29 10 30 6 24
4th Year 4th Year 4 29 3 30 - -
BSHRM BSHRM
1st Year 1st Year 8 31 8 26 - -
2nd Year 2nd Year 9 11 9 8 - -
3rd Year 3rd Year 3 8 3 8 7 6
4th Year 4th Year 12 14 10 11 - -
BSIT BSIT
1st Year 1st Year 22 16 28 13 - -
2nd Year 2nd Year 18 13 15 12 - -
3rd Year 3rd Year 17 14 13 12 11 10
4th Year 4th Year 18 21 14 17 - -
BSOA BSOA
1st Year 1st Year
2nd Year 2nd Year
3rd Year 3rd Year
4th Year 4th Year
BS PSYCH BS PSYCH
1st Year 1st Year
2nd Year 2nd Year
3rd Year 3rd Year
4th Year 4th Year
BSE- ENGLISH BSE- ENGLISH
1st Year 1st Year
2nd Year 2nd Year
3rd Year 3rd Year
4th Year 4th Year
ACS ACS
1st Year 1st Year 1 36 1 33 1 17
2nd Year 2nd Year 0 23 0 19 - -
CCT CCT
1st Year 1st Year 29 8 28 9 - -
2nd Year 2nd Year 29 3 27 3 - -
DHRM DHRM
1st Year 1st Year 16 21 15 11 12 11
2nd Year 2nd Year 18 14 14 11 - -
NEW NEW
248 370 230 327 39 68
TOTAL TOTAL
618 557 107
Percent of Increase / Percent of Increase / 14.6% -11.0%
Decrease Decrease
Prepared by: Noted:
MARY ANN L. ANONAS NOEL A. SEDIGO