
Page 9 - CvSU Trece Campus Enrollment History
P. 9
A
V
IT
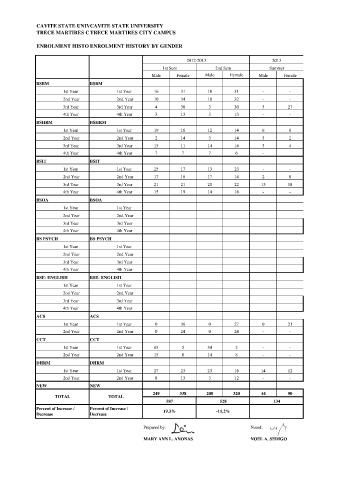
CAVITE STATE UNIVERSITYE STATE UNIVERSITY
C
M
T
R
A
C
R
TRECE MARTIRES CITY CAMPUSTIRES CITY CAMPUS
E
E
E
N
M
E
O
L
R
ENROLMENT HISTORY BY GENDERHISTORY BY GENDER
N
T
2012-2013 2013
1st Sem 2nd Sem Summer
Male Female Male Female Male Female
BSBM BSBM
1st Year 1st Year 16 31 18 31 - -
2nd Year 2nd Year 10 34 10 32 - -
3rd Year 3rd Year 4 30 3 30 3 27
4th Year 4th Year 3 13 3 13 - -
BSHRM BSHRM
1st Year 1st Year 19 16 12 14 6 6
2nd Year 2nd Year 2 14 3 14 3 2
3rd Year 3rd Year 15 11 14 14 3 4
4th Year 4th Year 7 7 7 6 -
BSIT BSIT
1st Year 1st Year 25 17 13 23 - -
2nd Year 2nd Year 17 16 17 14 2 0
3rd Year 3rd Year 21 21 20 22 13 18
4th Year 4th Year 15 19 14 18 - -
BSOA BSOA
1st Year 1st Year
2nd Year 2nd Year
3rd Year 3rd Year
4th Year 4th Year
BS PSYCH BS PSYCH
1st Year 1st Year
2nd Year 2nd Year
3rd Year 3rd Year
4th Year 4th Year
BSE- ENGLISH BSE- ENGLISH
1st Year 1st Year
2nd Year 2nd Year
3rd Year 3rd Year
4th Year 4th Year
ACS ACS
1st Year 1st Year 0 36 0 27 0 21
2nd Year 2nd Year 0 24 0 24 - -
CCT CCT
1st Year 1st Year 45 5 34 2 - -
2nd Year 2nd Year 15 8 14 8 - -
DHRM DHRM
1st Year 1st Year 27 23 23 16 14 12
2nd Year 2nd Year 8 13 3 12 - -
NEW NEW
249 338 208 320 44 90
TOTAL TOTAL
587 528 134
Percent of Increase / Percent of Increase / 19.3% -11.2%
Decrease Decrease
Prepared by: Noted:
MARY ANN L. ANONAS NOEL A. SEDIGO