
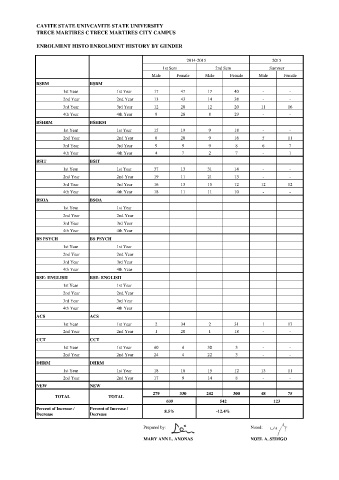
Page 13 - CvSU Trece Campus Enrollment History
P. 13
A
                                   V
                                     IT
              CAVITE STATE UNIVERSITYE STATE UNIVERSITY
                                 C

                                       M
                                 T
                                           R
                                         A
                                    C
                                  R
              TRECE MARTIRES CITY CAMPUSTIRES CITY CAMPUS
                                      E
                                   E
                                         E
                                  N
                                       M
                                 E
                                     O
                                      L
                                   R

              ENROLMENT HISTORY BY GENDERHISTORY BY GENDER
                                          N
                                           T
                                                                   2014-2015                     2015
                                                          1st Sem            2nd Sem            Summer
                                                      Male     Female    Male     Female    Male     Female
              BSBM               BSBM
                       1st Year           1st Year     17        47       17       40        -         -
                       2nd Year           2nd Year     13        43       14       38        -         -
                       3rd Year           3rd Year     12        20       12       20        11       16
                       4th Year           4th Year     9         28       8        29        -         -
              BSHRM              BSHRM
                       1st Year           1st Year     15        19       9        18        -         -
                       2nd Year           2nd Year     8         20       9        16        5        11
                       3rd Year           3rd Year     9         9        9         8        6         7
                       4th Year           4th Year     4         7        2         7        -         1
              BSIT               BSIT
                       1st Year           1st Year     37        13       31       14        -         -
                       2nd Year           2nd Year     19        11       21       13        -         -
                       3rd Year           3rd Year     16        13       15       12        12       12
                       4th Year           4th Year     18        11       11       10        -         -
              BSOA               BSOA
                       1st Year           1st Year
                       2nd Year           2nd Year
                       3rd Year           3rd Year
                       4th Year           4th Year
              BS PSYCH           BS PSYCH
                       1st Year           1st Year
                       2nd Year           2nd Year
                       3rd Year           3rd Year
                       4th Year           4th Year
              BSE- ENGLISH       BSE- ENGLISH
                       1st Year           1st Year
                       2nd Year           2nd Year
                       3rd Year           3rd Year
                       4th Year           4th Year
              ACS                ACS
                       1st Year           1st Year     2         34       2        31        1        17
                       2nd Year           2nd Year     1         20       1        18        -         -
              CCT                CCT
                       1st Year           1st Year     40        4        30        3        -         -
                       2nd Year           2nd Year     24        4        22        3        -         -
              DHRM               DHRM
                       1st Year           1st Year     18        18       15       12        13       11
                       2nd Year           2nd Year     17        9        14        8        -         -
              NEW                NEW
                                                       279      330       242      300       48       75
                    TOTAL              TOTAL
                                                           609                542                123
              Percent of Increase /   Percent of Increase /   8.5%           -12.4%
              Decrease           Decrease

                                                   Prepared by:                          Noted:

                                                   MARY ANN L. ANONAS                    NOEL A. SEDIGO